April 1st, 2026
New
Feature
What's new
PDF joins the existing export options -- available alongside Excel and JSON from the same Export menu you already use.
Download a PDF of any technology model analysis -- a clean, formatted document you can share with anyone, no Koi account required.
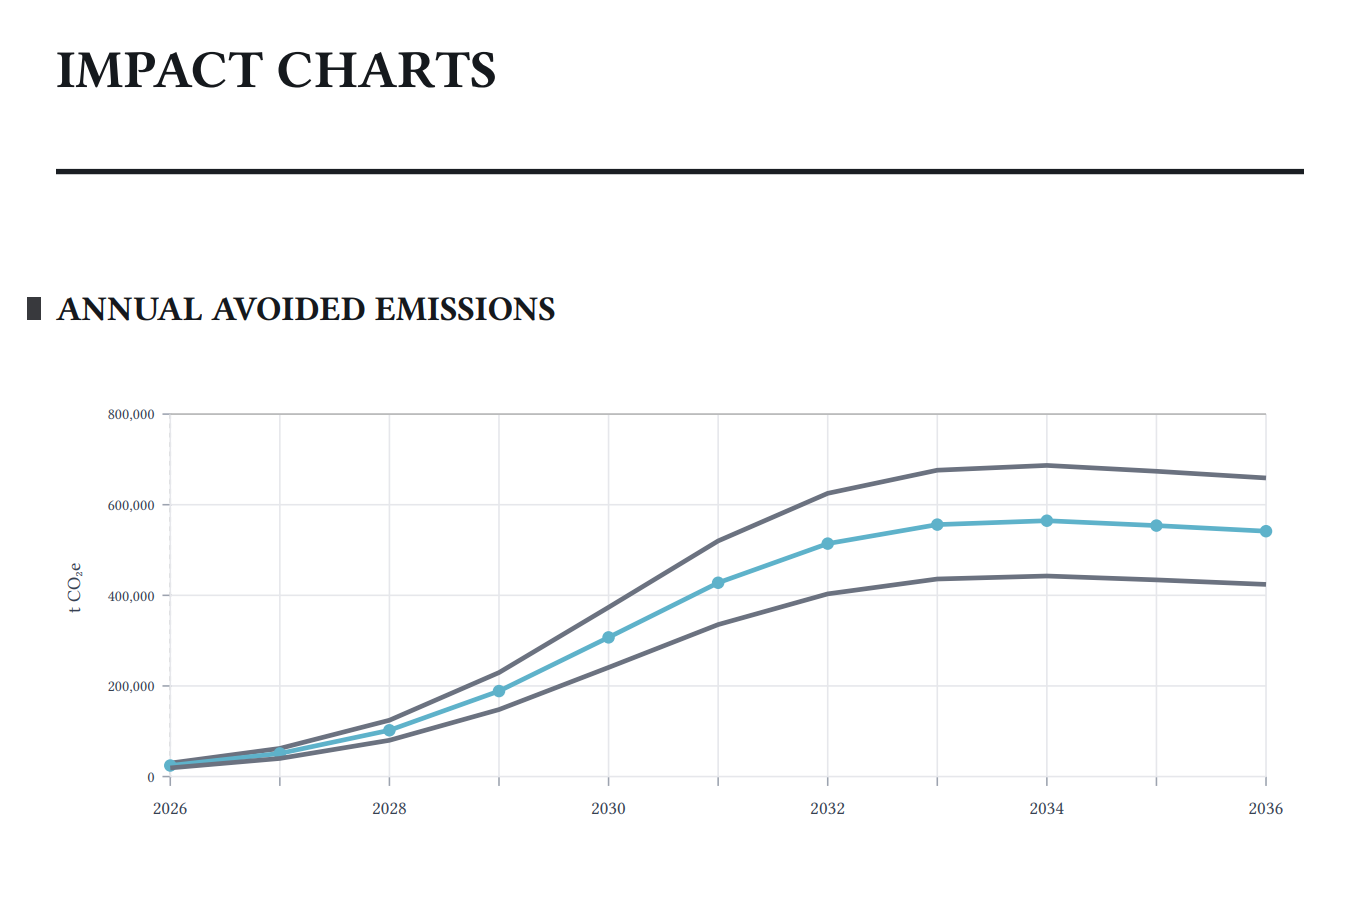
Analysis charts included -- Annual Avoided Emissions, Cumulative Avoided Emissions, Unit Impact, and Solution Scale are captured and embedded alongside the model data.
Why is it important?
Until now, sharing an analysis externally meant exporting a spreadsheet or raw data file -- formats that require effort to interpret. The PDF export produces a ready-to-send document that presents your findings clearly, making it easy to include avoided emissions results in a report, deck, proposal, or due diligence package without any extra formatting work.
How Do I Use It?
Open a technology model analysis.
Click Export.
Select PDF Export from the available options.
Keep the window open while Koi prepares your document -- a progress indicator will let you know what's happening.
The file downloads automatically when it's ready.

Who is this for?
Researchers and analysts sharing findings with partners, clients, or reviewers who don't use Koi.
Investment and sustainability teams including avoided emissions data in decks, memos, or proposals.
Procurement teams capturing a point-in-time record of a model's current state to share internally or with vendors in a portable format.
FAQ
Which charts are included? Annual Avoided Emissions, Cumulative Avoided Emissions, Unit Impact, and Solution Scale -- the same charts visible in the analysis view.
Do I need special access? The PDF option is available to anyone who can already export from a model. If a model is locked, it will need to be unlocked first -- the same requirement as other export formats.
How long does it take? It may take a few minutes. The progress indicator will update as it works -- just keep the window open until the download starts.
February 19th, 2026
What's new
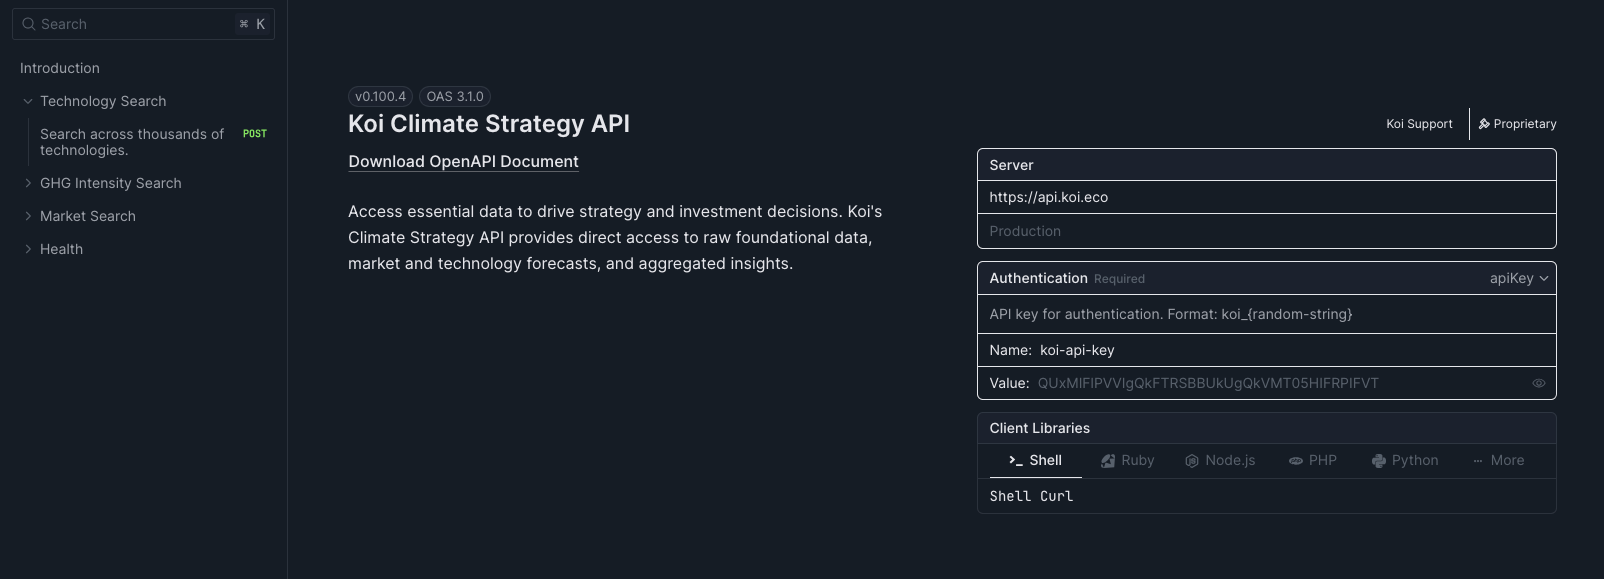
REST API — Search for climate technologies, GHG emission intensities, and addressable markets using natural language queries powered by vector search
Secure API key authentication — Organization-scoped API keys with role-based permissions that inherit from your license tier and integrate seamlessly with Koi's existing access controls
Auto-generated OpenAPI documentation — Explore and interact with the available endpoints in the Koi Docs
Why is it important?
Climate impact analysis shouldn't be locked inside a single application. The Koi Data API unlocks programmatic access to our climate technology database, enabling you to integrate impact data directly into your workflows, tools, and applications. Whether you're building internal dashboards, automating portfolio analysis, or enriching your own datasets, the API gives you the flexibility to use Koi's data where and how you need it—without manual exports or copy-paste workflows.
This opens new possibilities: automated screening processes, real-time impact monitoring, custom reporting systems, and seamless integration with your existing data infrastructure. Your API keys inherit your organization's permissions, so you maintain the same access controls and data quality standards you rely on in the Koi web application.
How Do I Use It?
1. Request an API Key
Contact us to request an API key for your organization.
2. Make Your First Request
Use your API key to search for climate technologies:
curl https://api.koi.eco/v0/query/technologies \ --request POST \ --header 'Content-Type: application/json' \ --header 'koi-api-key: YOUR_SECRET_TOKEN' \ --data '{ "query": "", "topK": 1000, "limit": 5, "dataScope": "public", "includeAnalysis": false, "includeIndustries": false, "qaStatusFilter": [ "FULLVAL" ], "analysisPeriod": { "startYear": 2025, "endYear": 2040 } }' The API returns structured data including technology descriptions, GHG impact calculations, addressable market sizes, industry classifications, and quality assurance indicators.
3. Explore the Full API
Refer to our documentation at https://docs.koi.eco/docs/api/reference to explore all available endpoints, request parameters, and response schemas.
Who is this for?
Data Engineers — Integrate Koi's climate data into internal data warehouses, ETL pipelines, or analytics platforms
Impact Analysts — Build custom screening tools, automated reports, or portfolio-wide impact dashboards
Product Teams — Embed climate impact data into your own applications and user experiences
FAQ
How does API key authentication work? API keys are SHA-256 hashed and stored securely in the database. They inherit permissions from your organization's active license tier and the role assigned to the key.
What happens if I exceed my organization's usage limits? API keys follow the same credit and permission model as the web application. If your organization runs out of credits or your license tier changes, API access will be adjusted accordingly. Contact your account manager if you need to increase capacity.
December 11th, 2025
What's new
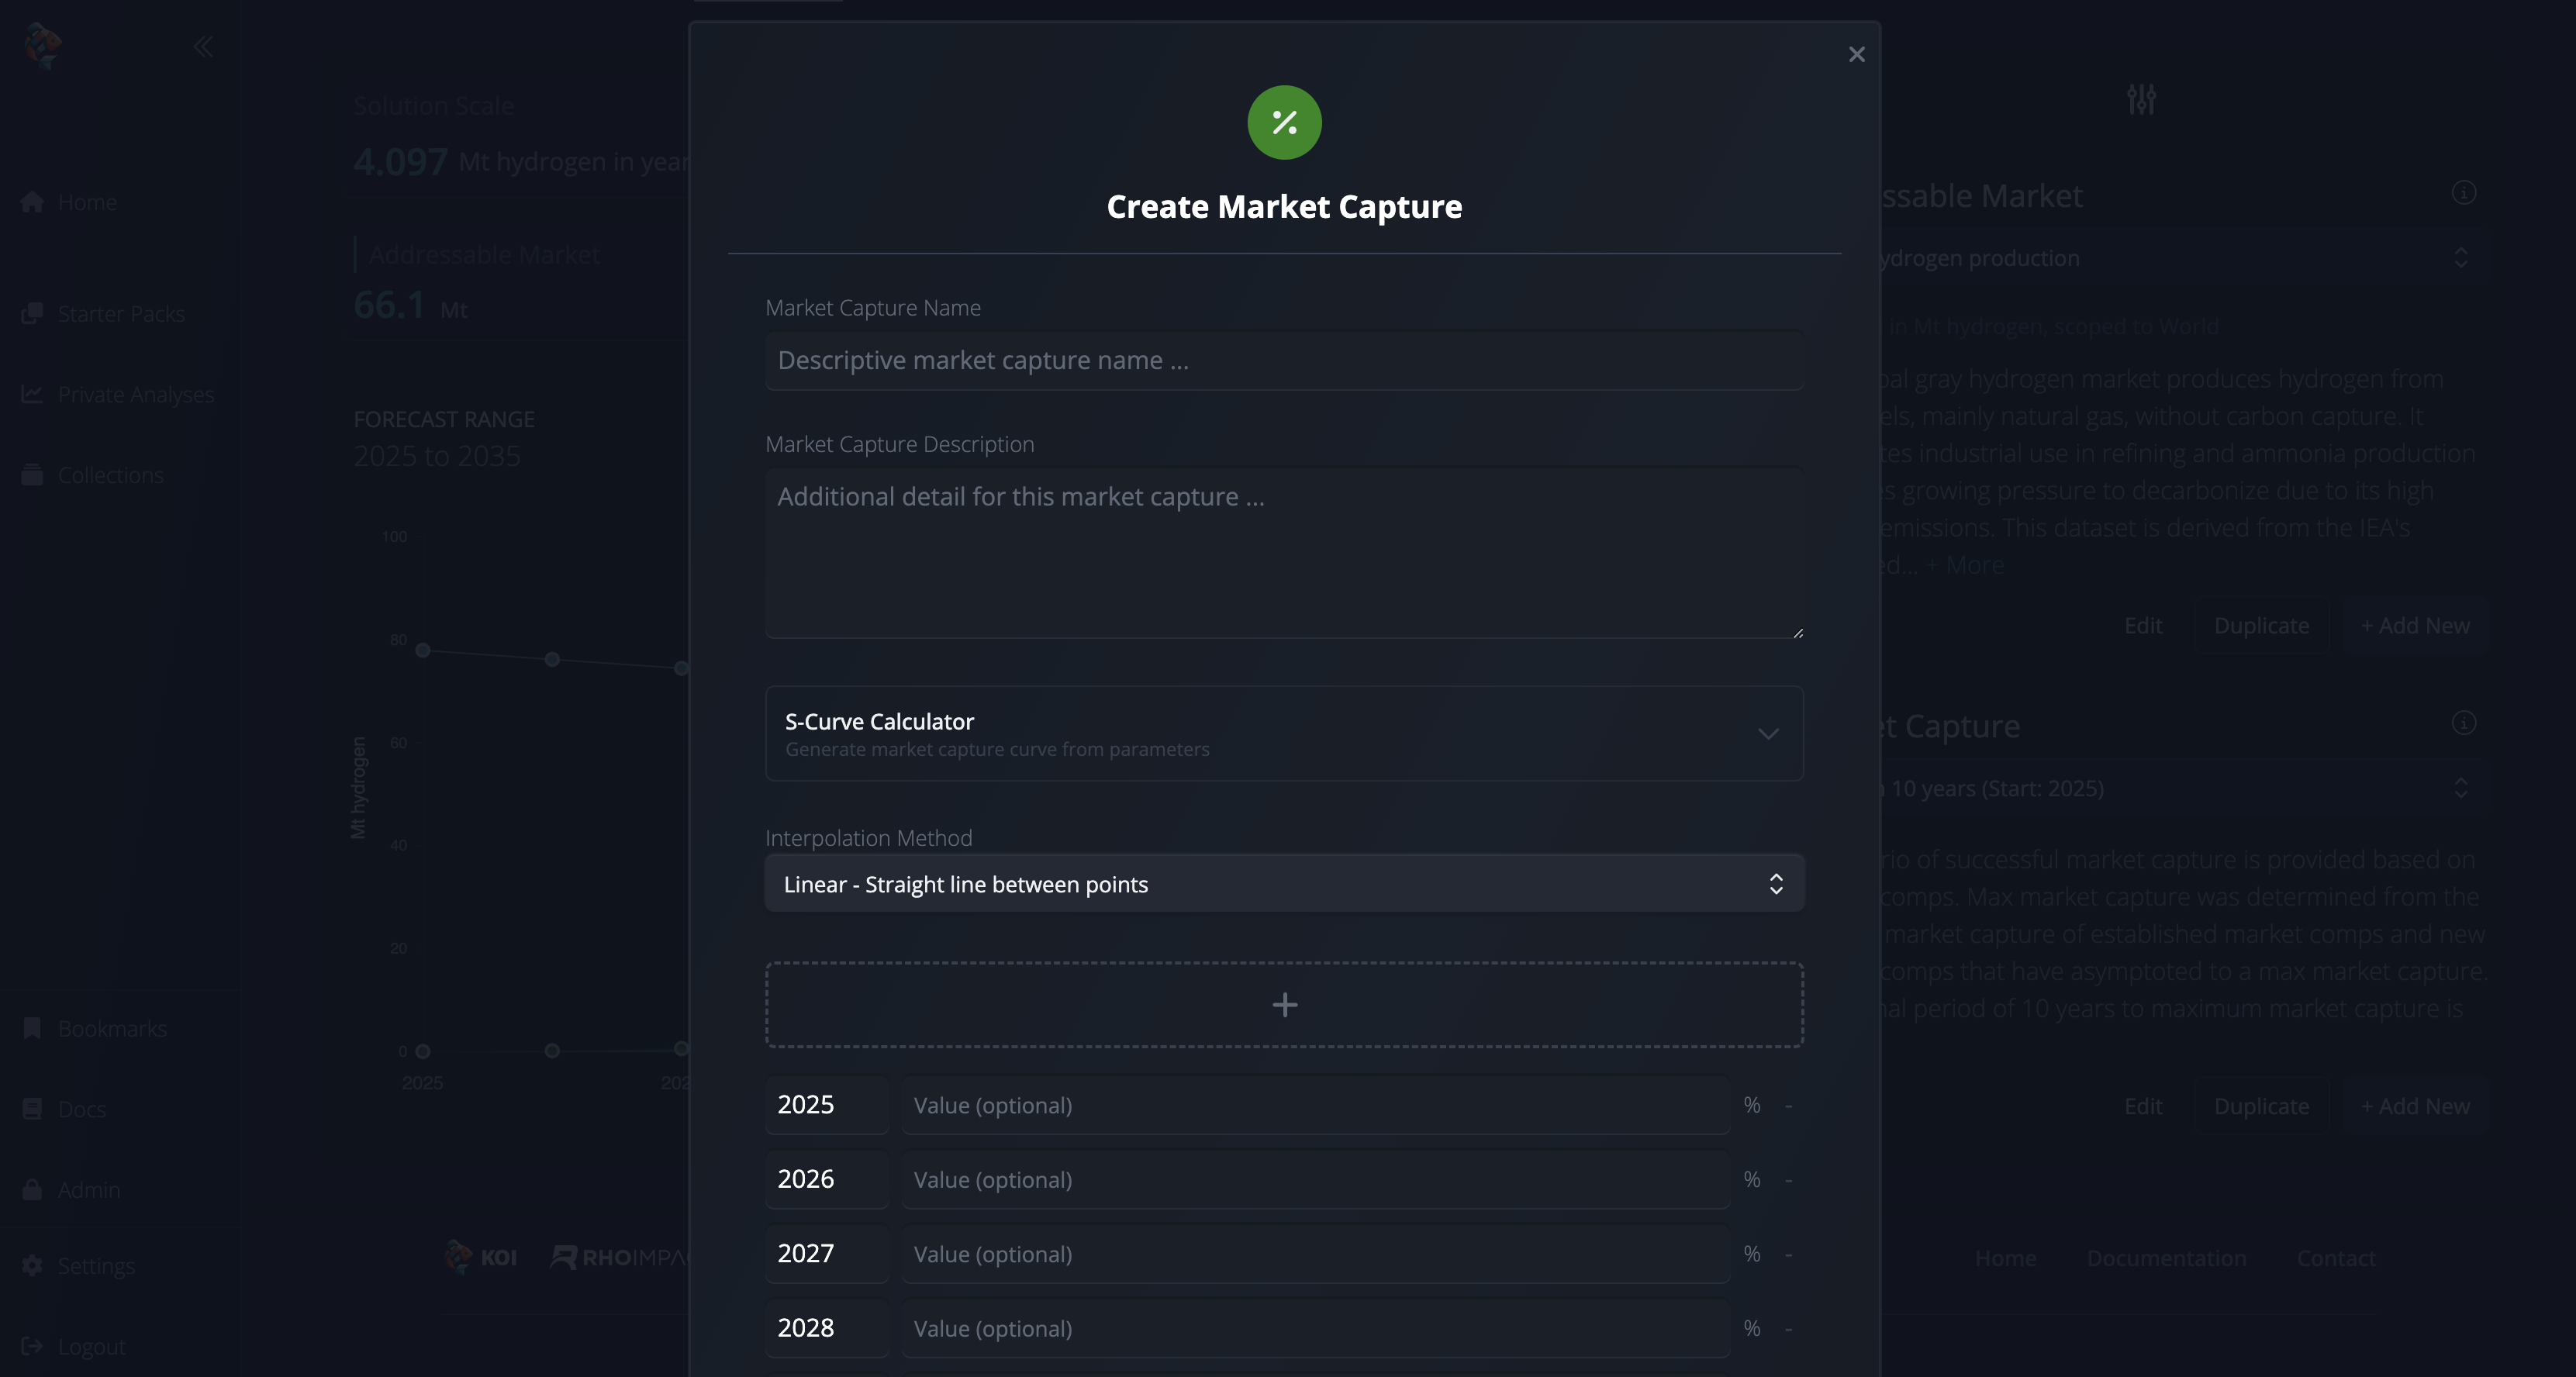
Multiple data entry methods — choose how you build your market capture curve: manually enter year-value pairs, generate curves with the S-curve calculator, or use interpolation methods to fill gaps between key data points.
Smart interpolation — select from linear, exponential, or other interpolation methods to automatically fill empty values between your data points.
S-curve calculator — generate mathematically sound adoption curves from key parameters like max saturation and start year.
Clone and edit for scenarios — create variant market captures to explore "what-if" scenarios while preserving your baseline assumptions.

Why is it important?
Market capture data reveals how technologies actually penetrate their target markets, turning theoretical efficiency into real-world impact. Even the most efficient climate technology has limited emissions reduction if adoption stalls. This redesign makes sophisticated market analysis accessible to everyone by offering flexible data entry: start with sparse data points and let interpolation fill the gaps, use the S-curve calculator for theory-based projections, or manually craft your own curve. You can now model realistic adoption scenarios in whichever way best suits your available data and analytical approach.
How Do I Use It?
Creating a Market Capture
Navigate to any technology model's Analysis page
Select Edit Mode from the Actions menu
Select the Solution Scale tab, expand the right sidebar, and select Add New under the Market Capture section
Choose your data entry method:
Manual entry: Enter year-value pairs directly for complete control
S-curve calculator: Generate curves from parameters like max saturation and start year or select from our preset parameters to model Slower, Standard, or Accelerated growth.
Interpolation: Enter key data points, then select an interpolation method (linear, exponential, etc.) to automatically fill gaps
Save your market capture—it's now associated with that technology model
From here, you can Duplicate your market capture and Edit it to adjust parameters for comparison.

Who is this for?
Impact Analysts — model realistic adoption curves on market penetration assumptions
Researchers — compare adoption scenarios across multiple technologies to identify high-potential interventions
Entrepreneurs — understand your company's impact based on your sales projections
FAQ
Which data entry method should I use?
Use the S-curve calculator when you have theory-based assumptions about technology diffusion. Use interpolation when you have key milestone projections and want to fill the gaps with a smooth curve. Use manual entry when you have complete year-by-year data or need precise control over every value.
What interpolation methods are available?
You can choose from linear interpolation (straight line between points), exponential interpolation (accelerating or decelerating curves), and other methods depending on your data characteristics and adoption assumptions.
What's the difference between duplicating and editing?
Editing modifies the existing market capture (creating a new version in its history). Duplicating creates an entirely new market capture, perfect for scenario analysis where you want to preserve the original as a baseline.
How does the S-curve calculator work?
The S-curve calculator uses diffusion theory to generate realistic adoption trajectories. Define key parameters like max saturation, takeover, and steepness, and the calculator generates year-value pairs that follow the desired S-curve pattern. For ease, we also provide a selection of preset parameters to model Slower, Standard, and Accelerated market adoption.
September 18th, 2025
Improved
What’s new?
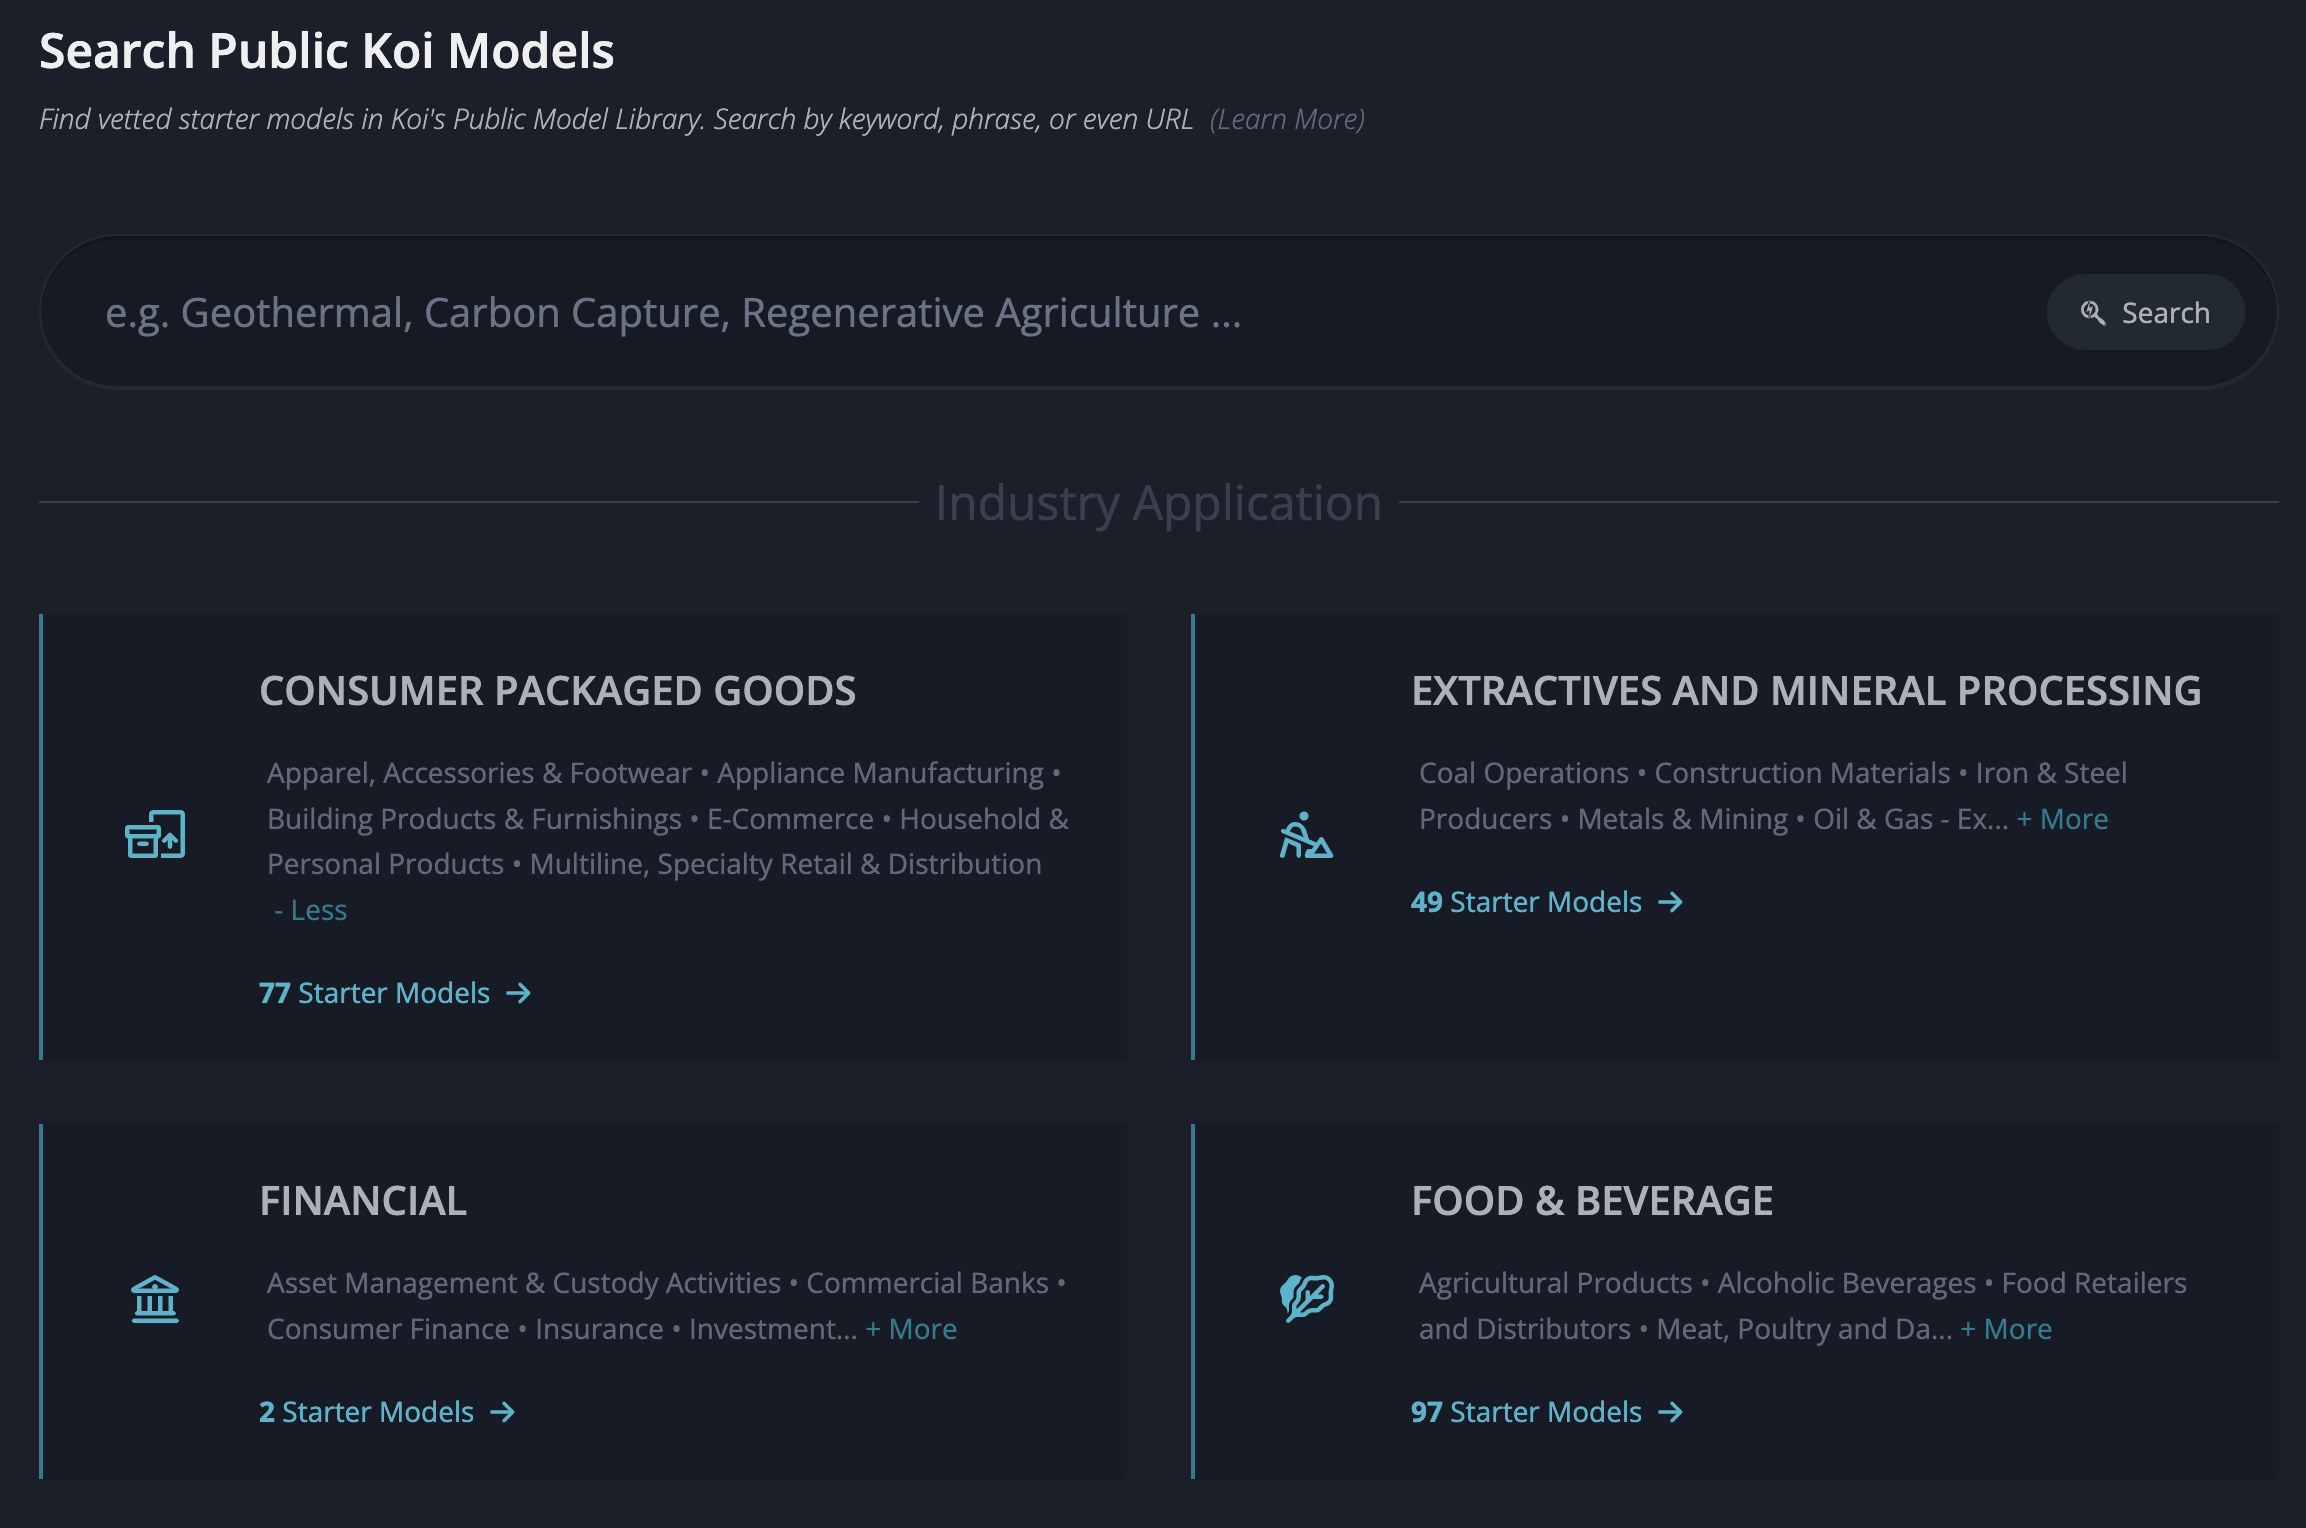
Fresh UI - The search experience has been redesigned with a cleaner layout, so it’s easier to find exactly what you’re looking for.
Industry applications - Not sure where to start? Browse models grouped by industry to explore what’s available.
Model Previews — Peek into key scenarios and markets right from the search results to decide if a model is worth a deeper dive.

Why is it important?
Finding the right model is the first step to answering your questions. Our library helps you get to the data faster, even if you don’t know the exact model name. Whether you want to browse broadly by sector or zero in on something specific, you now have multiple ways to get there.
How do I use it?
From the Home page, click Model Library or head to Library in the side navigation.
Enter a keyword, phrase, or even a domain URL to surface relevant public models. Alternatively, select an Industry Application to browse grouped models without needing a starting term.
Use the Preview panel in results to check out scenarios and markets before deciding whether to open the full model.
FAQ
What counts as an Industry Application?
Industry Applications are curated categories derived from the SASB (Sustainability Accounting Standards Board) industry classification system. They bundle together public models so you can explore an entire theme in one place.Can I search using a company website?
Yes—if you enter a domain URL, we’ll show you public models connected to that company’s technology or industry.What if I don’t find what I need?
Keep an eye on the Library—we’re adding new public models regularly. You can also request a model from the Koi team if there’s a gap.
August 15th, 2025
What’s new?
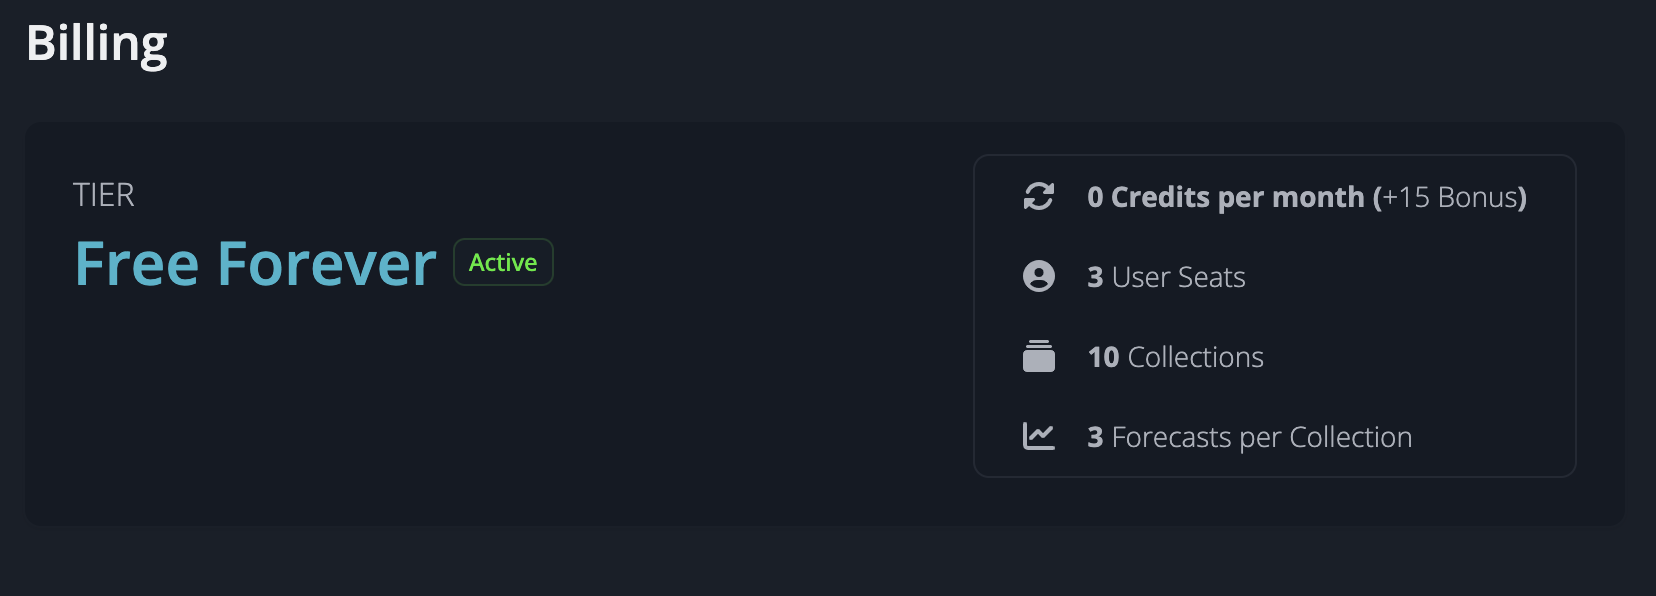
Free Forever tier: View data for every public model—reports, charts, assumptions, and high-level details—without paying.
Self-serve billing: Manage subscriptions, buy credits, and track usage directly in-app.
“Free to see, pay to use” pricing: Core viewing stays open; advanced actions (references, cloning, exporting, private sharing) require an unlock.

Why is it important?
You can explore Koi without friction, then pay only when you need deeper functionality. Self-serve billing gives you control—no back-and-forth emails to upgrade, add credits, or check usage.
This makes Koi more accessible if you’re curious about climate-tech impact, while reserving advanced tooling once you’ve identified your specific use cases.
How Do I Use It?
Create an account on Koi to browse any public model.
When you’re ready to go deeper, unlock with credits or upgrade your plan.
Visit Settings → Billing/Usage to see your plan, credit balance, and payment options.
What stays gated?
Full references
Cloning & editing for full customization
Exporting data (Excel, JSON, and more)
Sharing private models outside of your organization
FAQ
What can I do with a free license?
With a free license, you can add a couple additional team members to your organization account, browse all public models, and add those models to collections. We also provide you a starting set of Koi credits, so you can unlock a few models of interest at no charge.
What happens when I run out of credits?
You can continue viewing public models freely as well as any models you’ve previously unlocked, but you’ll be unable to perform advanced actions until you purchase more credits or upgrade your plan.
Can I collaborate with my team?
Yes - the free tier includes a few additional seats for your organization. All users within an organization have access to the same unlocked public models. Similarly, the pool of credits available to you is shared across the team.
July 25th, 2025
New
Improved
Feature
What’s new?
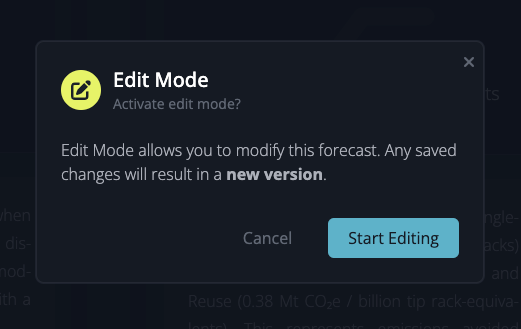
Edit Mode — we gave editing features a facelift for a cleaner UI and to prevent inadvertent changes.
Version History — edits to models result in a new version, so the history of changes is preserved and auditable.
Why is it important?
Versioned edits provide a complete, tamper-proof record of every change to your Koi models. You can trace how data inputs evolved over time, refer to older versions if a new version produces unexpected results, and demonstrate to regulators or stakeholders that your impact forecasts are accurate, reproducible, and rigorously governed.
How Do I Use It?
Edit Mode
To modify a private model, select Edit Mode from the Actions menu. A pencil icon or Edit button will appear next to editable components, which include:
Model name
Addition or removal of scenarios and markets
Details for baseline and solution scenarios
Value chain phases for baseline and solution
Addressable market details and values
Market capture parameters
References
You can preview your edits in real-time. Once satisfied, click Save in the upper right corner. You will then be prompted to classify your changes as either Major or Minor to help maintain a clear version history of your model. Once saved, your modifications will be reflected in the model.

Who is this for?
Impact Analysts evaluating how changes to assumptions or data inputs affect avoided‐emissions forecasts
Compliance Teams needing a complete trail of edits for regulatory reporting
Stakeholders & Reviewers who want to see when and why key model parameters were adjusted
FAQ
How do I view earlier versions?
To view earlier versions, go to a model's Datasheet and select the desired version under Viewing Version.
Who can view my changes?
Once a new version is saved, anyone with access to the private model can see the updated version.
Is there a limit to how many versions are stored?
No - make as many updates as you’d like, and retain all of the historical context.
June 20th, 2025
What’s new?
Koi Credits — a flexible currency to unlock deeper features on an as-needed basis.
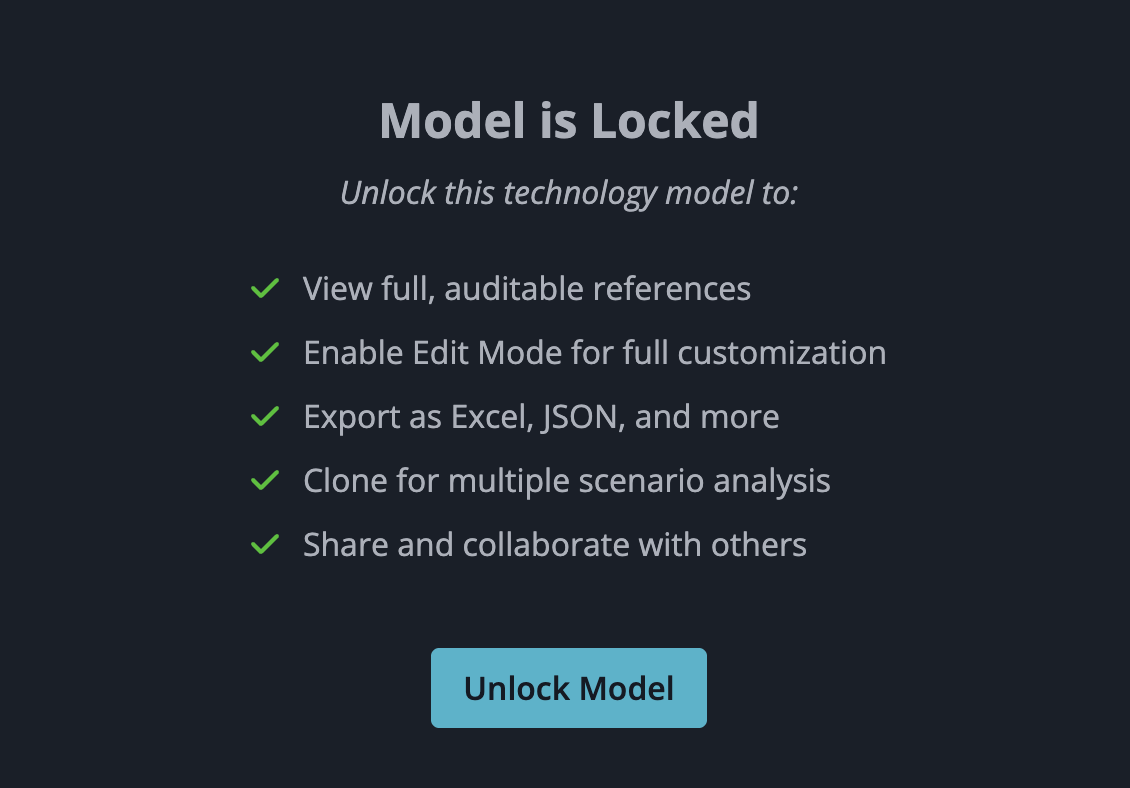
Unlock Technology Model — we’ve opened all public models so anyone can view. Spend 5 credits to access full references, clone/customize, export, and share private models.
Why is it important?
Wider adoption stalls when impact data is hard to find, slow to parse, or too expensive. So we made the essentials free: fast, trustworthy numbers you can actually use. Koi Credits kick in only when you move from “looking” to “doing”—customizing, exporting, or collaborating in ways that would otherwise cost far more time and money.
How Do I Use It?
Acquiring Koi Credits
Koi credits are a flexible currency within Koi that can be used to unlock advanced features. You receive Koi credits when you:
Signup / upgrade bonuses (never expire)
Monthly allotments with paid plans (expire at month’s end)
One-time / top-up purchases (never expire)
Org-wide pool: Credits are shared across your Organization. Anyone in your organization can spend credits. Anything one teammate unlocks is unlocked for everyone.
Check your balance, expirations, and purchase options on the Usage page. See the Pricing page for how many credits come with each plan.

Spending Koi Credits
Currently, Koi Credits can only be used to Unlock a Technology Model. In the future, there will be additional advanced features available to unlock. When you unlock a technology model, you will have access to:
The full reference lists
Clone & customize the model
Export all data to XLSX or JSON
Share private models with others
How to Unlock a Model
Open a technology model forecast
Go to the Datasheet tab
Click Unlock Model
Done—those features are now available for that specific version
Note: When you unlock a technology model, you are only unlocking the version of the technology model that you are currently viewing. You will not have full access to prior or future versions of that technology model.

Who is this for?
Explorers comparing multiple models
Builders tweaking assumptions or exporting data
Collaborators sharing private work inside (or outside) the Org
FAQ
Which credits are used when I unlock a model?
Koi automatically applies the credits that expire first. Once those are gone, it uses any non‑expiring credits.
Does my team share a pool of credits?
Credits are shared between all users in your Organization. Any user within your Organization can use your Organization’s credits. If you unlock a model, any users within your organization will also view that model as unlocked.
How does this work with sharing?
When you share a private model with a user outside your organization, that model will be locked for them. If you have granted them editor or manager access, they will be able to view and edit the references to your model. If you have granted them manager access, they will be able to share your model with others. However, they will not be able to clone or export your model until they have unlocked it themselves.
March 19th, 2025
What's New?
We're excited to introduce enhanced sharing capabilities in Koi! You can now share your custom forecasts and collections directly with your team members or external stakeholders. Whether you're collaborating on an analysis or showcasing your impact, sharing is now seamless.
Why Is It Important?
We know effective collaboration is crucial for impactful climate action. With our new sharing features, you can easily showcase your analyses and scenarios—whether it's with teammates, investors, or partners—making it simple and clear to share your impact proudly.
How Do I Use It?
Share a Custom Forecast
Navigate to the custom forecast you want to share.
Click the "Share" button.
Enter an email or group, Select the permissions for that entity, and Click share. You will see that entity appear in the list below.
Note: All versions of the forecast within this collection will automatically be shared as well, as well as all GHG intensities and market data.
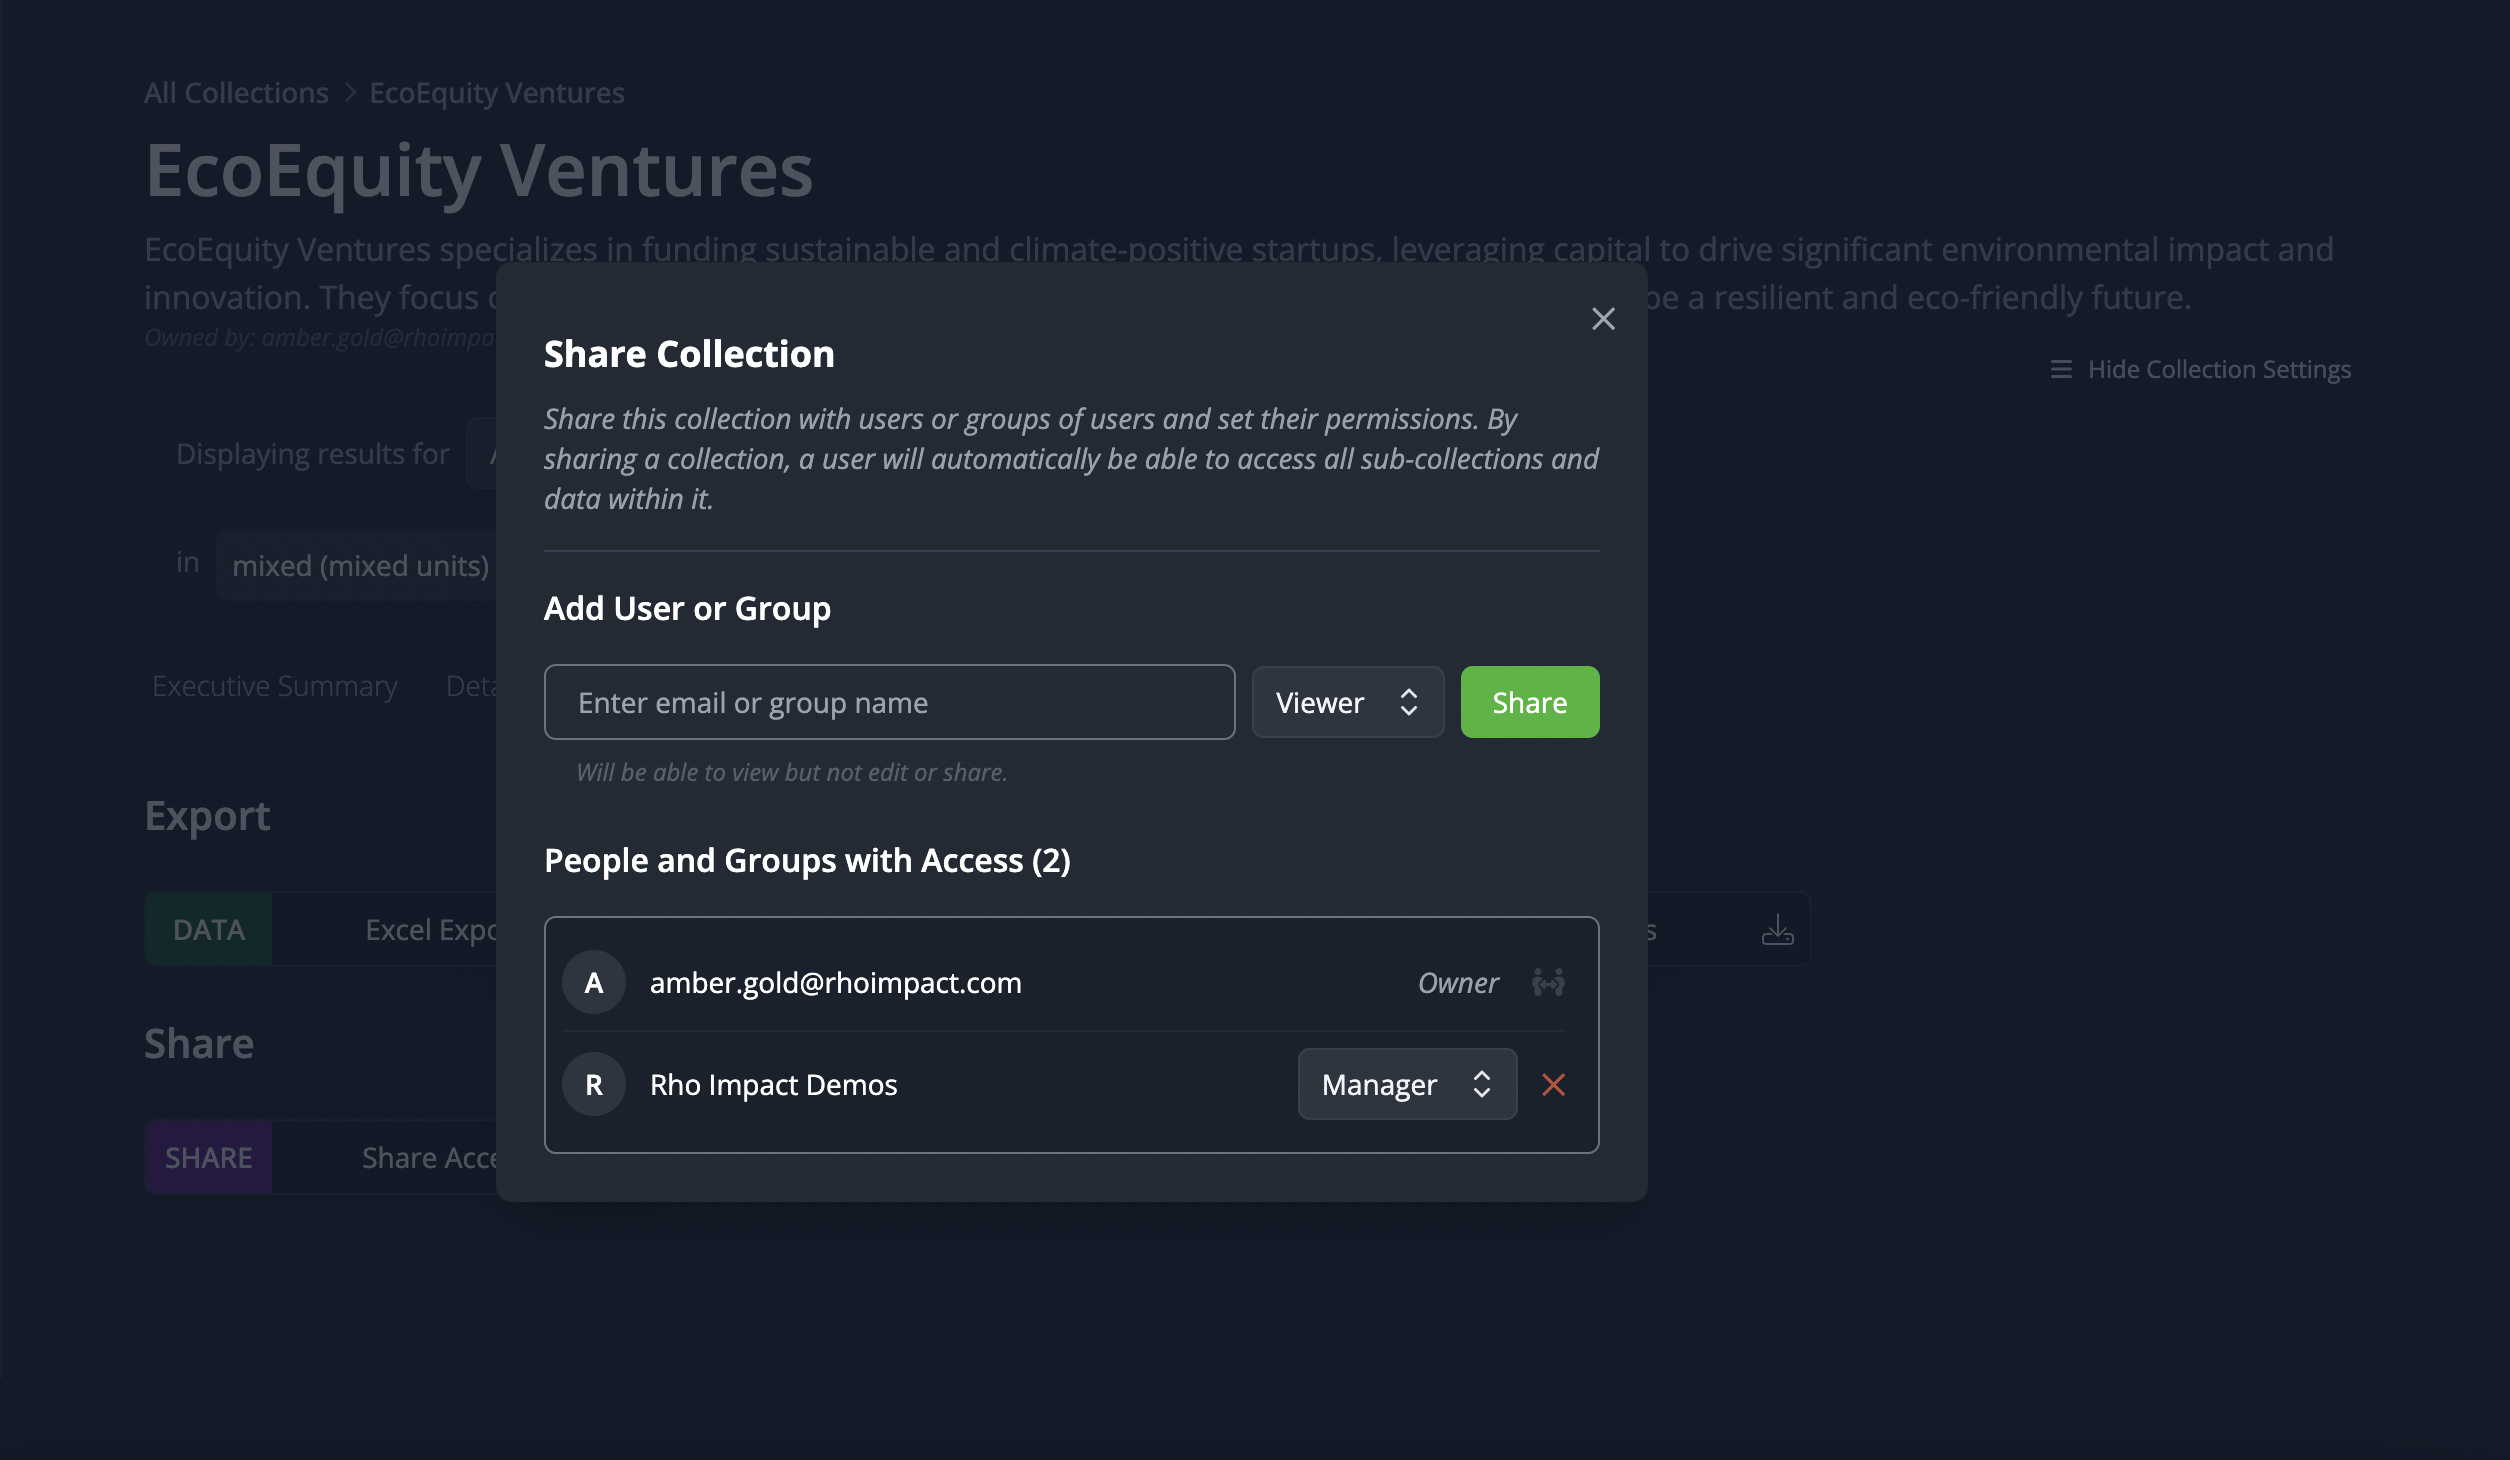
Share a Collection
Go to the collection you want to share.
Go to the Shared & Export tab. Click the "Share" option.
Enter an email or group, Select the permissions for that entity, and Click share. You will see that entity appear in the list below.
Note: Access to all sub-collections and custom forecasts within this collection will automatically be granted as well. Should you remove access to a collection, access to all that collection’s children will be removed as well unless shared separately.
Permissions
When sharing, you can control how others interact with your data using three levels of access:
Viewer: Can view the collection or forecast but cannot make any changes.
Editor: Can modify a forecast or collection they have access to, including editing any subcollections or forecasts within collections, as well as adjusting GHG intensities and market data of forecasts.
Manager: Has full control over the shared item, including the abilities to share, edit, and manage permissions. Managers can also view all users with whom a forecast or collection has been shared, not just those they have personally shared with. A manager cannot remove access from the owner.
These roles are designed to facilitate effective collaboration while maintaining appropriate control over your data.
Pro Tips
Share with Non-Registered Users: You can share your forecasts and collections with individuals who don't have a Koi account yet. When they sign up for Koi, they will automatically have access to that data.
Share with Groups: If you're collaborating with a team, consider creating a group within Koi. Sharing your forecasts or collections with a group ensures all members have immediate access, simplifying management and enhancing teamwork.
Stay Updated: Shared items reflect real-time updates and provide access to all versions of the data, so your collaborators always have the latest information.
Frequently Asked Questions
Can I restrict access to certain parts of a shared collection?
Currently, sharing a collection grants access to all its contents, including subcollections and custom forecasts. If you need more control, consider structuring your collections accordingly.
How do I know who has access to my shared items?
In the sharing settings of each forecast or collection, you can view and manage the list of collaborators.
Can collaborators share my forecasts or collections with others?
Yes—but only if you grant them Manager permissions. Otherwise, they will not be able to share your data with others directly (but they may be able to make a copy and share that).
Coming Soon
Email Notification of Sharing – In the future, Koi will automatically notify users via email when a forecast or collection is shared with them. Currently, you'll need to manually inform users about shared items.
Request Access – If you come across a forecast or collection you need access to, you can send a request to the owner for permission, streamlining collaboration.
Share a Snapshot – Share a static, view-only version of your data (instead of live updates).
Transfer Ownership – Move ownership of a forecast or collection to another user.
Shareable Link – Open access to anyone with a model or collection link. However, a user will alway need a Koi account to view any Koi data for security purposes.
Want these features faster? Check out our public roadmap where you can upvote them or request a feature to let us know what’s most important to you!
February 17th, 2025

What’s New?
We're excited to introduce "Collections" — a versatile new feature in Koi designed to organize, group, and compare various analyses, datasets, or sub-collections. Whether you're:
assessing a single company with different impact scenarios,
managing a portfolio of companies,
or even coordinating multiple portfolios,
collections enables aggregate data views and analysis. Manage analysis complexity with built-in comparisons of outcomes from different scenarios or markets and gain a clear perspective on potential impacts.
Why Is It Important?
In the ever-evolving world of investment and innovation, staying ahead means understanding the ripple effects of each technological intervention. Collections offer a structured playground to compare and contrast various scenarios and representations of your innovations or investments. Supercharge your decision-making with both aggregated and detailed comparisons now available within Collections.
How Do I Use It?
Create a Collection: Begin by creating a new Collection under the Library section in My Account. Collections can represent anything from a single company to complex market comparisons to a portfolio of companies (and beyond).
Add Data: Add relevant analyses to your Collection by navigating to a technology model and selecting "Add to Collection". You can incorporate various elements such as technology models, baseline scenarios, solution scenarios, market sizes, and market captures. It's also possible to add incomplete analyses and update them later.
Compare or View Aggregate Results: Delve into the aggregated data or explore specific comparisons to tailor insights to your strategic needs.
Pro Tips
Nested Collections: Utilize the ability to nest Collections within one another to create a multi-layered data hierarchy. This enables portfolio or technology class segmentation, as we have seen requested by some Koi users. For uniformity, we recommend creating a shell collection for each analysis so you can add your own description and allocation factor.
Allocation Factors: Assign an allocation factor (from 0% to 100%) to each sub-collection within a Collection. This allows you to specify the influence each sub-collection has on the overall avoided emissions calculations of the parent collection.
Automated Unit Conversion: Combine and view your results in any unit you want with automated unit conversions. “Mixed” units are the default units for each individual analysis. In order to view a rollup of your results, you’ll need to select a unit that is not “mixed”.
Frequently Asked Questions
Are there any limits to the number of Collections I can create? There are currently no limits to the number of Collections or components you can create, allowing you to scale your analysis as needed.
Can I view the aggregate impact of a Collection? Yes, you can view the aggregate impact of a Collection by using the comparison/rollup toggle located in the collection settings toolbar. *However, exercise caution as this process can lead to potential double-counting of avoided emissions across different technologies. It's important to remember that the summed values within a Collection may not accurately represent the total impact.
Can I share Collections with my team members or other organizations? Sharing capabilities are under development and will be available soon!
Use Case 1: Create a Collection to Represent Your Current Portfolio of Company Investments
Objective: Manage and analyze a portfolio of investments in companies that are geared towards developing sustainable solutions.

Step-by-Step Guide:
Initiate a New Collection:
Navigate to the Library section under My Account.
Under Library > Collections click on “Create New Collection” and provide a descriptive name, for instance, “2025 Sustainability Portfolio”.
Add Companies to the Collection:
For each company in your portfolio, find a representative technology model in Koi by searching either by the company domain or technology name. Alternatively, you can create your own custom model.
From the technology page, click on “Add to Collection”. Add a collection with that company’s name. Then add the analysis to that new collection. Alternatively, create a new collection from the technology page when you click “Add to Collection”.
Organize and Structure the Collection:
Within All Collections (in My Account), add each company collection to your portfolio collection.
Optional: Within the Collection, organize companies by categories such as technology type, market impact, or investment size. For instance, separate companies into renewable energy, waste management, and sustainable agriculture.
Specify the allocation percentage if you want to denote how much of your resources are invested in each company on the details tab of your parent collection.
Analyze Portfolio Performance:
Use the Collections tooling to compare the performance and impact of different companies or technologies.
Analyze avoided emissions, market reach, and technological impact to assess which investments are performing according to your sustainability goals.
Adjust:
Add new companies or technologies to the collection as your investment strategy evolves over time.
Use Case 2: Compare Different Baseline Scenarios in a Model for a Sensitivity Analysis
Objective: To compare potential outcomes from displacing different incumbent technologies and evaluate the sensitivity of impact. This analysis will help to understand how variations in baseline assumptions (e.g., GHG intensities, market sizes) influence the projected impacts of proposed technologies.


Step-by-Step Guide:
Initiate a New Collection:
Navigate to the Library section under My Account.
Click on “Add New Collection” and name the collection to reflect your current investment portfolio, for instance, “Scenario Comparison”.
Select a Technology or Initiative:
Choose the technology or initiative for which you want to perform the sensitivity analysis. This selection should be based on strategic importance or where outcomes are most uncertain. In this example, we’ll compare Fermentation-Based Protein-Rich Meat Alternatives replacing chicken, beef, or poultry meat.
Set Up Baseline Scenarios:
Navigate to a technology model.
Select (or create) different baseline scenarios and markets reflect a range of possible conditions you want to explore. For instance:
Scenarios replacing chicken meat, beef meat, and poultry meat. Or,
A conservative scenario with lower market growth, an optimistic scenario with higher market adoption, and a best-guess scenario.
Once you have a scenario to include in the comparison (by selecting from baseline and market options), click “Add to Collection” and add it to your created Collection.
Compare Results:
Navigate to your Collection to view results. You can use the Executive Summary tab for a snapshot of the results or the Charts tab to visualize the time varying results.
Tip: You can change the type of results to view avoided emissions, baseline scenario impact, solution scenario impact, or market projections depending on what you want to investigate.
January 31st, 2025
New
Improved

What’s New?
Koi Studio is here! We have revamped the ways in which you access the tools and data inside Koi.
Why is it Important?
Koi has evolved to become a comprehensive modeling and collaboration suite and it was time to refresh the product interface to more adequately support core workflows. The new Koi Studio layout provides more rapid access to the key tools and features within Koi and is the beginning of a series of features we’re rolling out focused on collaboration and sharing across startups, investors, and asset owners.
How Do I Use it?
Easy! Just log in!
Pro Tip
Please give us feedback! We greatly appreciate any and all feedback, bug reports, feature requests, and more. Send us an email to feedback@koi.eco or submit directly at https://product.koi.eco