Changelog

Follow new updates and improvements to Koi.

Export Your Analysis as a PDF
What's new

  • PDF joins the existing export options -- available alongside Excel and JSON from the same Export menu you already use.

  • Download a PDF of any technology model analysis -- a clean, formatted document you can share with anyone, no Koi account required.

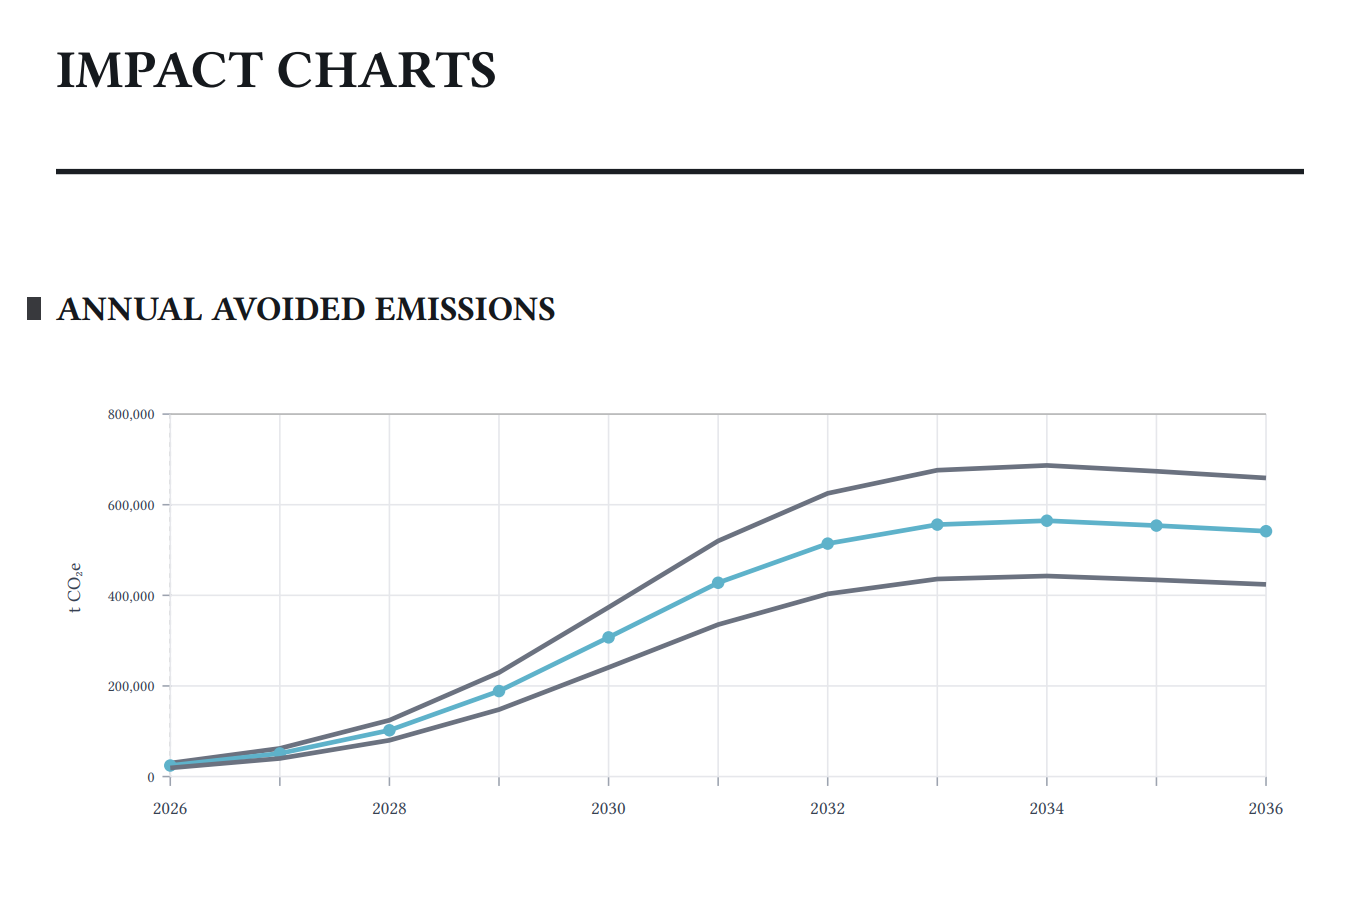
  • Analysis charts included -- Annual Avoided Emissions, Cumulative Avoided Emissions, Unit Impact, and Solution Scale are captured and embedded alongside the model data.


Why is it important?

Until now, sharing an analysis externally meant exporting a spreadsheet or raw data file -- formats that require effort to interpret. The PDF export produces a ready-to-send document that presents your findings clearly, making it easy to include avoided emissions results in a report, deck, proposal, or due diligence package without any extra formatting work.


How Do I Use It?

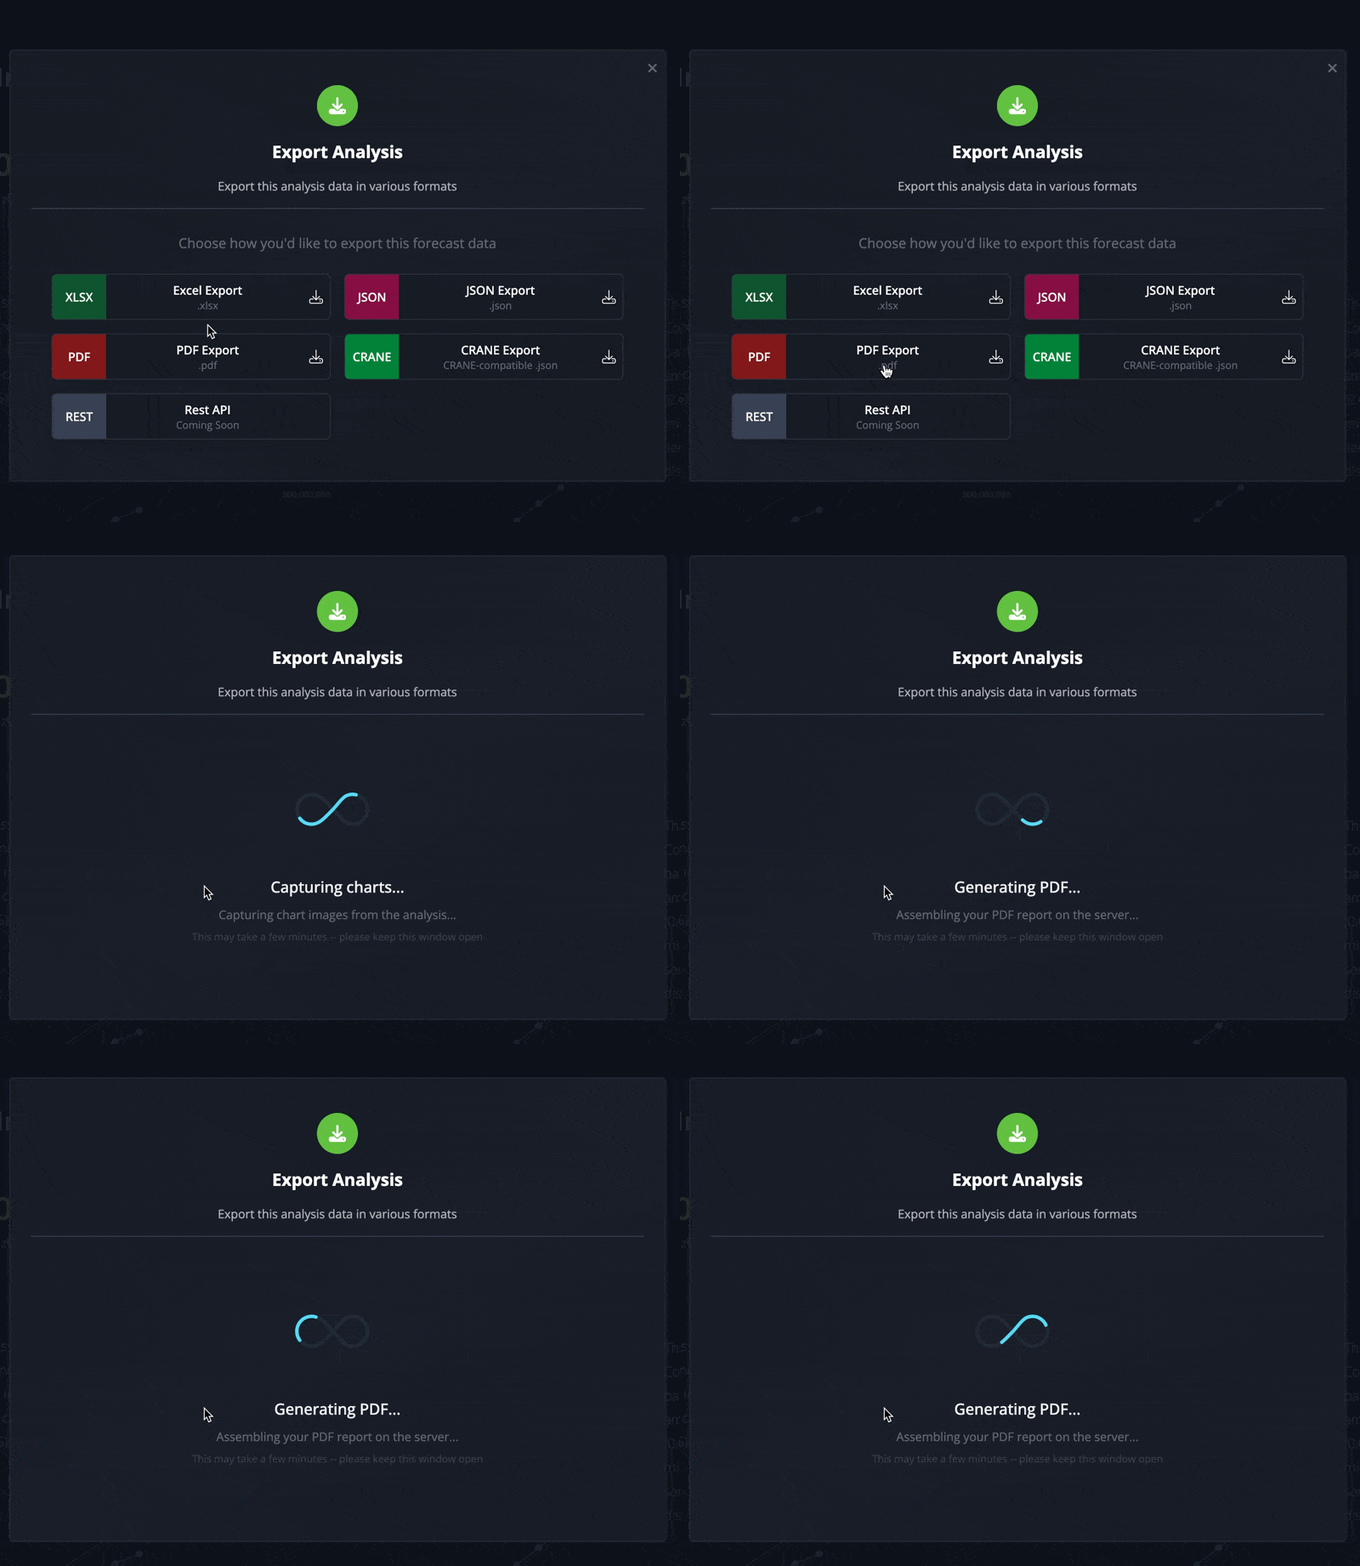
  1. Open a technology model analysis.

  2. Click Export.

  3. Select PDF Export from the available options.

  4. Keep the window open while Koi prepares your document -- a progress indicator will let you know what's happening.

  5. The file downloads automatically when it's ready.

Who is this for?

  • Researchers and analysts sharing findings with partners, clients, or reviewers who don't use Koi.

  • Investment and sustainability teams including avoided emissions data in decks, memos, or proposals.

  • Procurement teams capturing a point-in-time record of a model's current state to share internally or with vendors in a portable format.


FAQ

  • Which charts are included? Annual Avoided Emissions, Cumulative Avoided Emissions, Unit Impact, and Solution Scale -- the same charts visible in the analysis view.

  • Do I need special access? The PDF option is available to anyone who can already export from a model. If a model is locked, it will need to be unlocked first -- the same requirement as other export formats.

  • How long does it take? It may take a few minutes. The progress indicator will update as it works -- just keep the window open until the download starts.
Koi Data API: Programmatic Access to Climate Technology Data

What's new

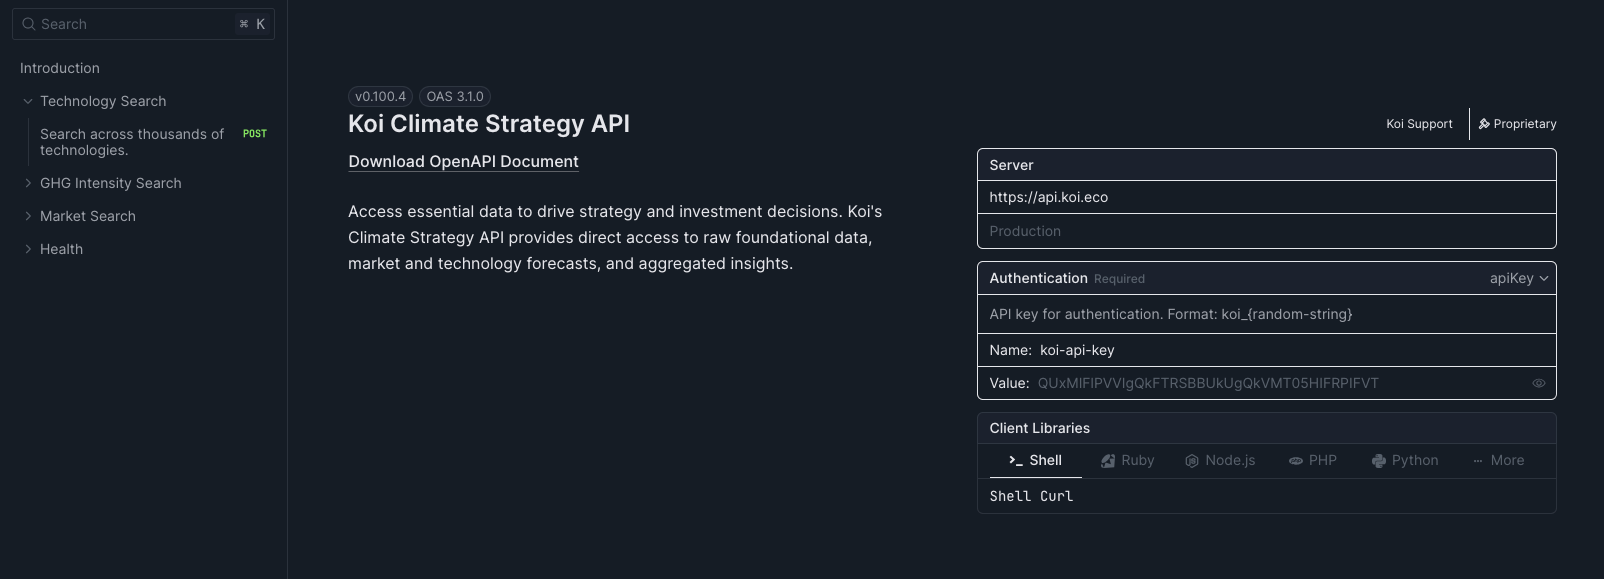
  • REST API — Search for climate technologies, GHG emission intensities, and addressable markets using natural language queries powered by vector search

  • Secure API key authentication — Organization-scoped API keys with role-based permissions that inherit from your license tier and integrate seamlessly with Koi's existing access controls

  • Auto-generated OpenAPI documentation — Explore and interact with the available endpoints in the Koi Docs

Why is it important?

Climate impact analysis shouldn't be locked inside a single application. The Koi Data API unlocks programmatic access to our climate technology database, enabling you to integrate impact data directly into your workflows, tools, and applications. Whether you're building internal dashboards, automating portfolio analysis, or enriching your own datasets, the API gives you the flexibility to use Koi's data where and how you need it—without manual exports or copy-paste workflows.

This opens new possibilities: automated screening processes, real-time impact monitoring, custom reporting systems, and seamless integration with your existing data infrastructure. Your API keys inherit your organization's permissions, so you maintain the same access controls and data quality standards you rely on in the Koi web application.


How Do I Use It?

1. Request an API Key

Contact us to request an API key for your organization.

2. Make Your First Request

Use your API key to search for climate technologies:

curl https://api.koi.eco/v0/query/technologies \ --request POST \ --header 'Content-Type: application/json' \ --header 'koi-api-key: YOUR_SECRET_TOKEN' \ --data '{ "query": "", "topK": 1000, "limit": 5, "dataScope": "public", "includeAnalysis": false, "includeIndustries": false, "qaStatusFilter": [ "FULLVAL" ], "analysisPeriod": { "startYear": 2025, "endYear": 2040 } }' 

The API returns structured data including technology descriptions, GHG impact calculations, addressable market sizes, industry classifications, and quality assurance indicators.

3. Explore the Full API

Refer to our documentation at https://docs.koi.eco/docs/api/reference to explore all available endpoints, request parameters, and response schemas.


Who is this for?

  • Data Engineers — Integrate Koi's climate data into internal data warehouses, ETL pipelines, or analytics platforms

  • Impact Analysts — Build custom screening tools, automated reports, or portfolio-wide impact dashboards

  • Product Teams — Embed climate impact data into your own applications and user experiences


FAQ

  • How does API key authentication work? API keys are SHA-256 hashed and stored securely in the database. They inherit permissions from your organization's active license tier and the role assigned to the key.

  • What happens if I exceed my organization's usage limits? API keys follow the same credit and permission model as the web application. If your organization runs out of credits or your license tier changes, API access will be adjusted accordingly. Contact your account manager if you need to increase capacity.

Market Capture Redesign

What's new

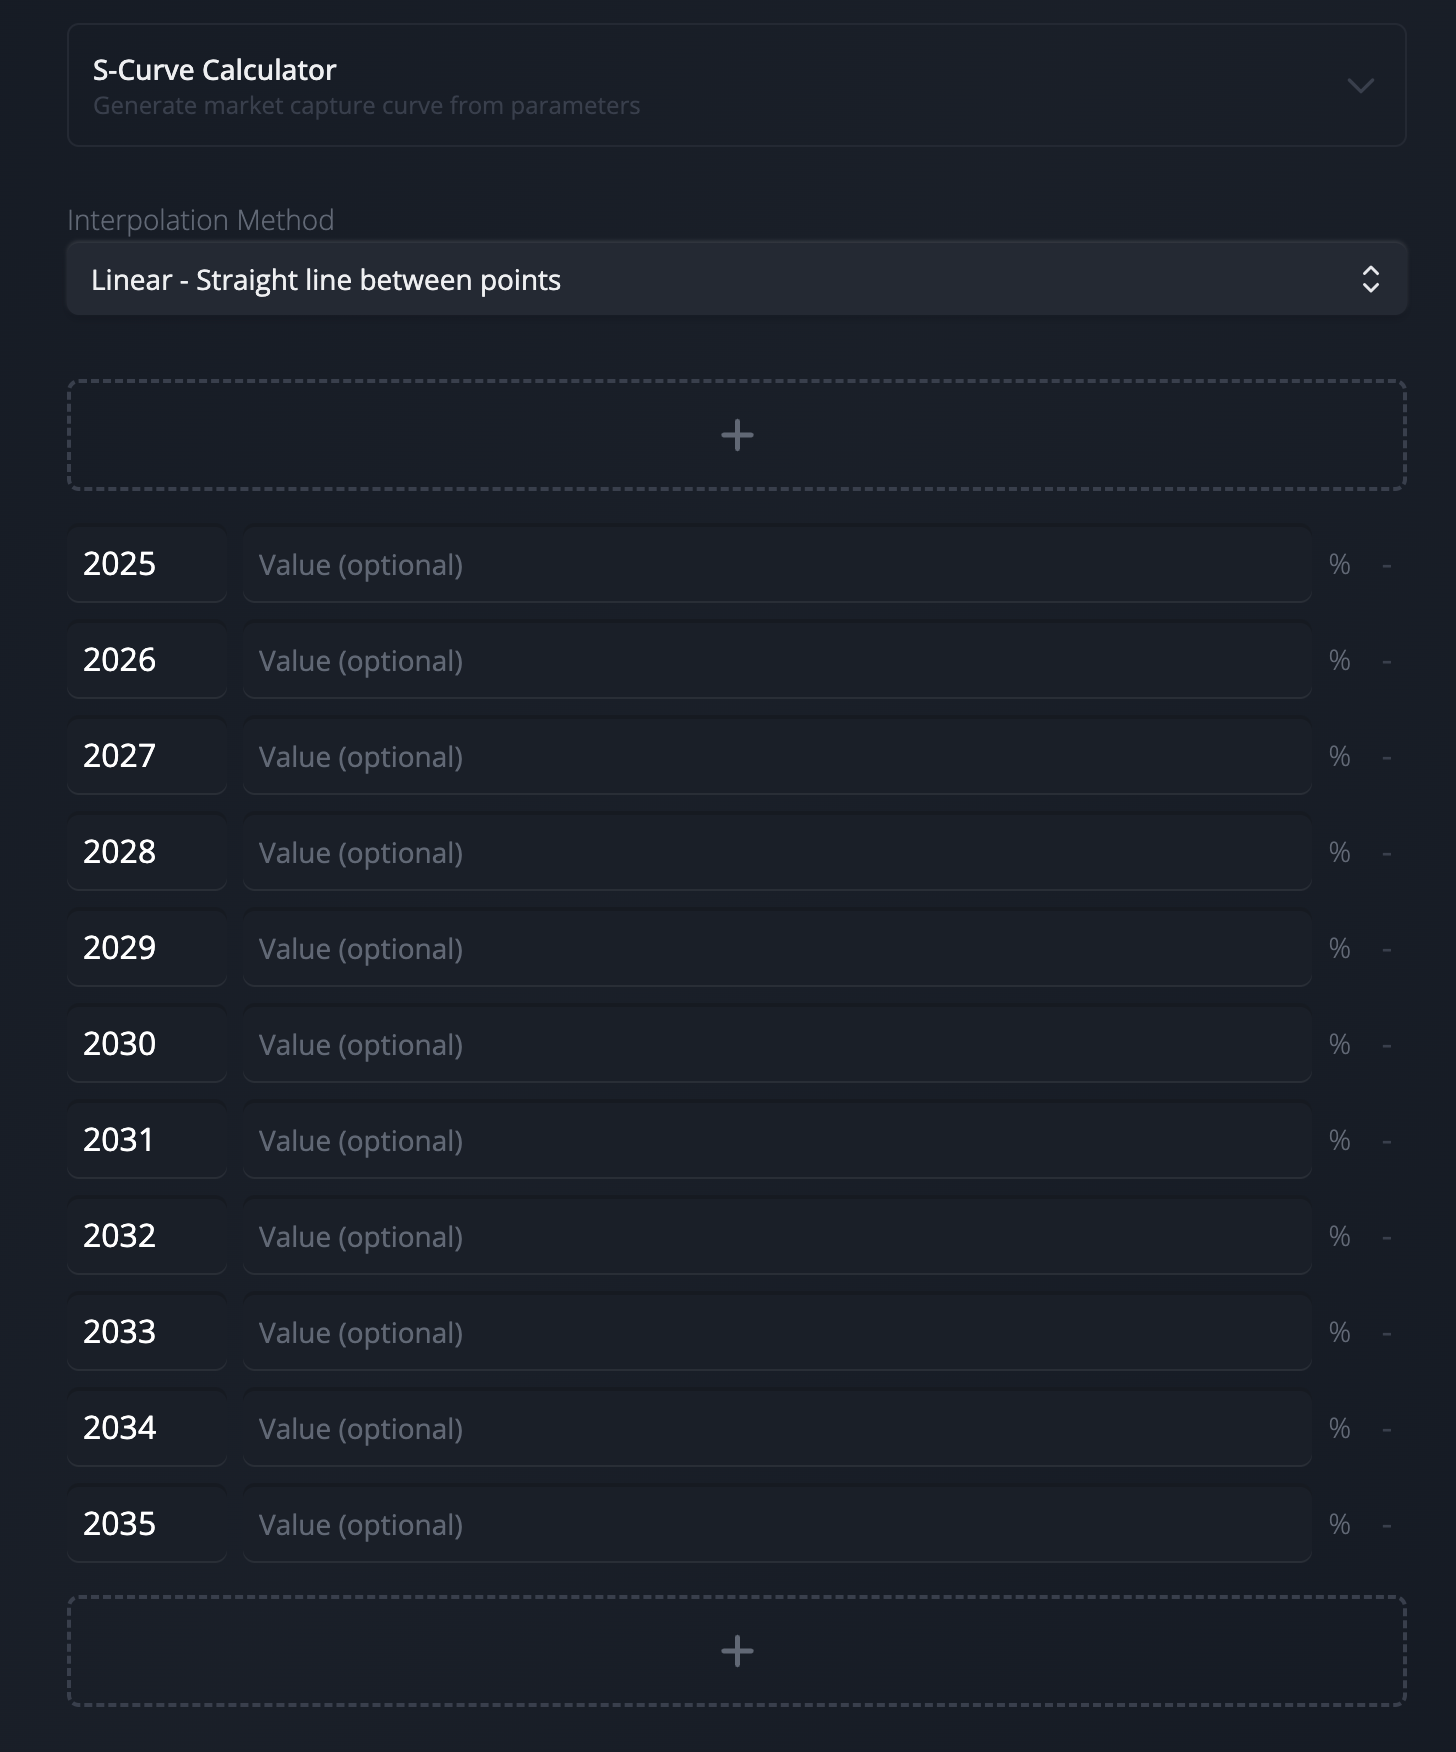
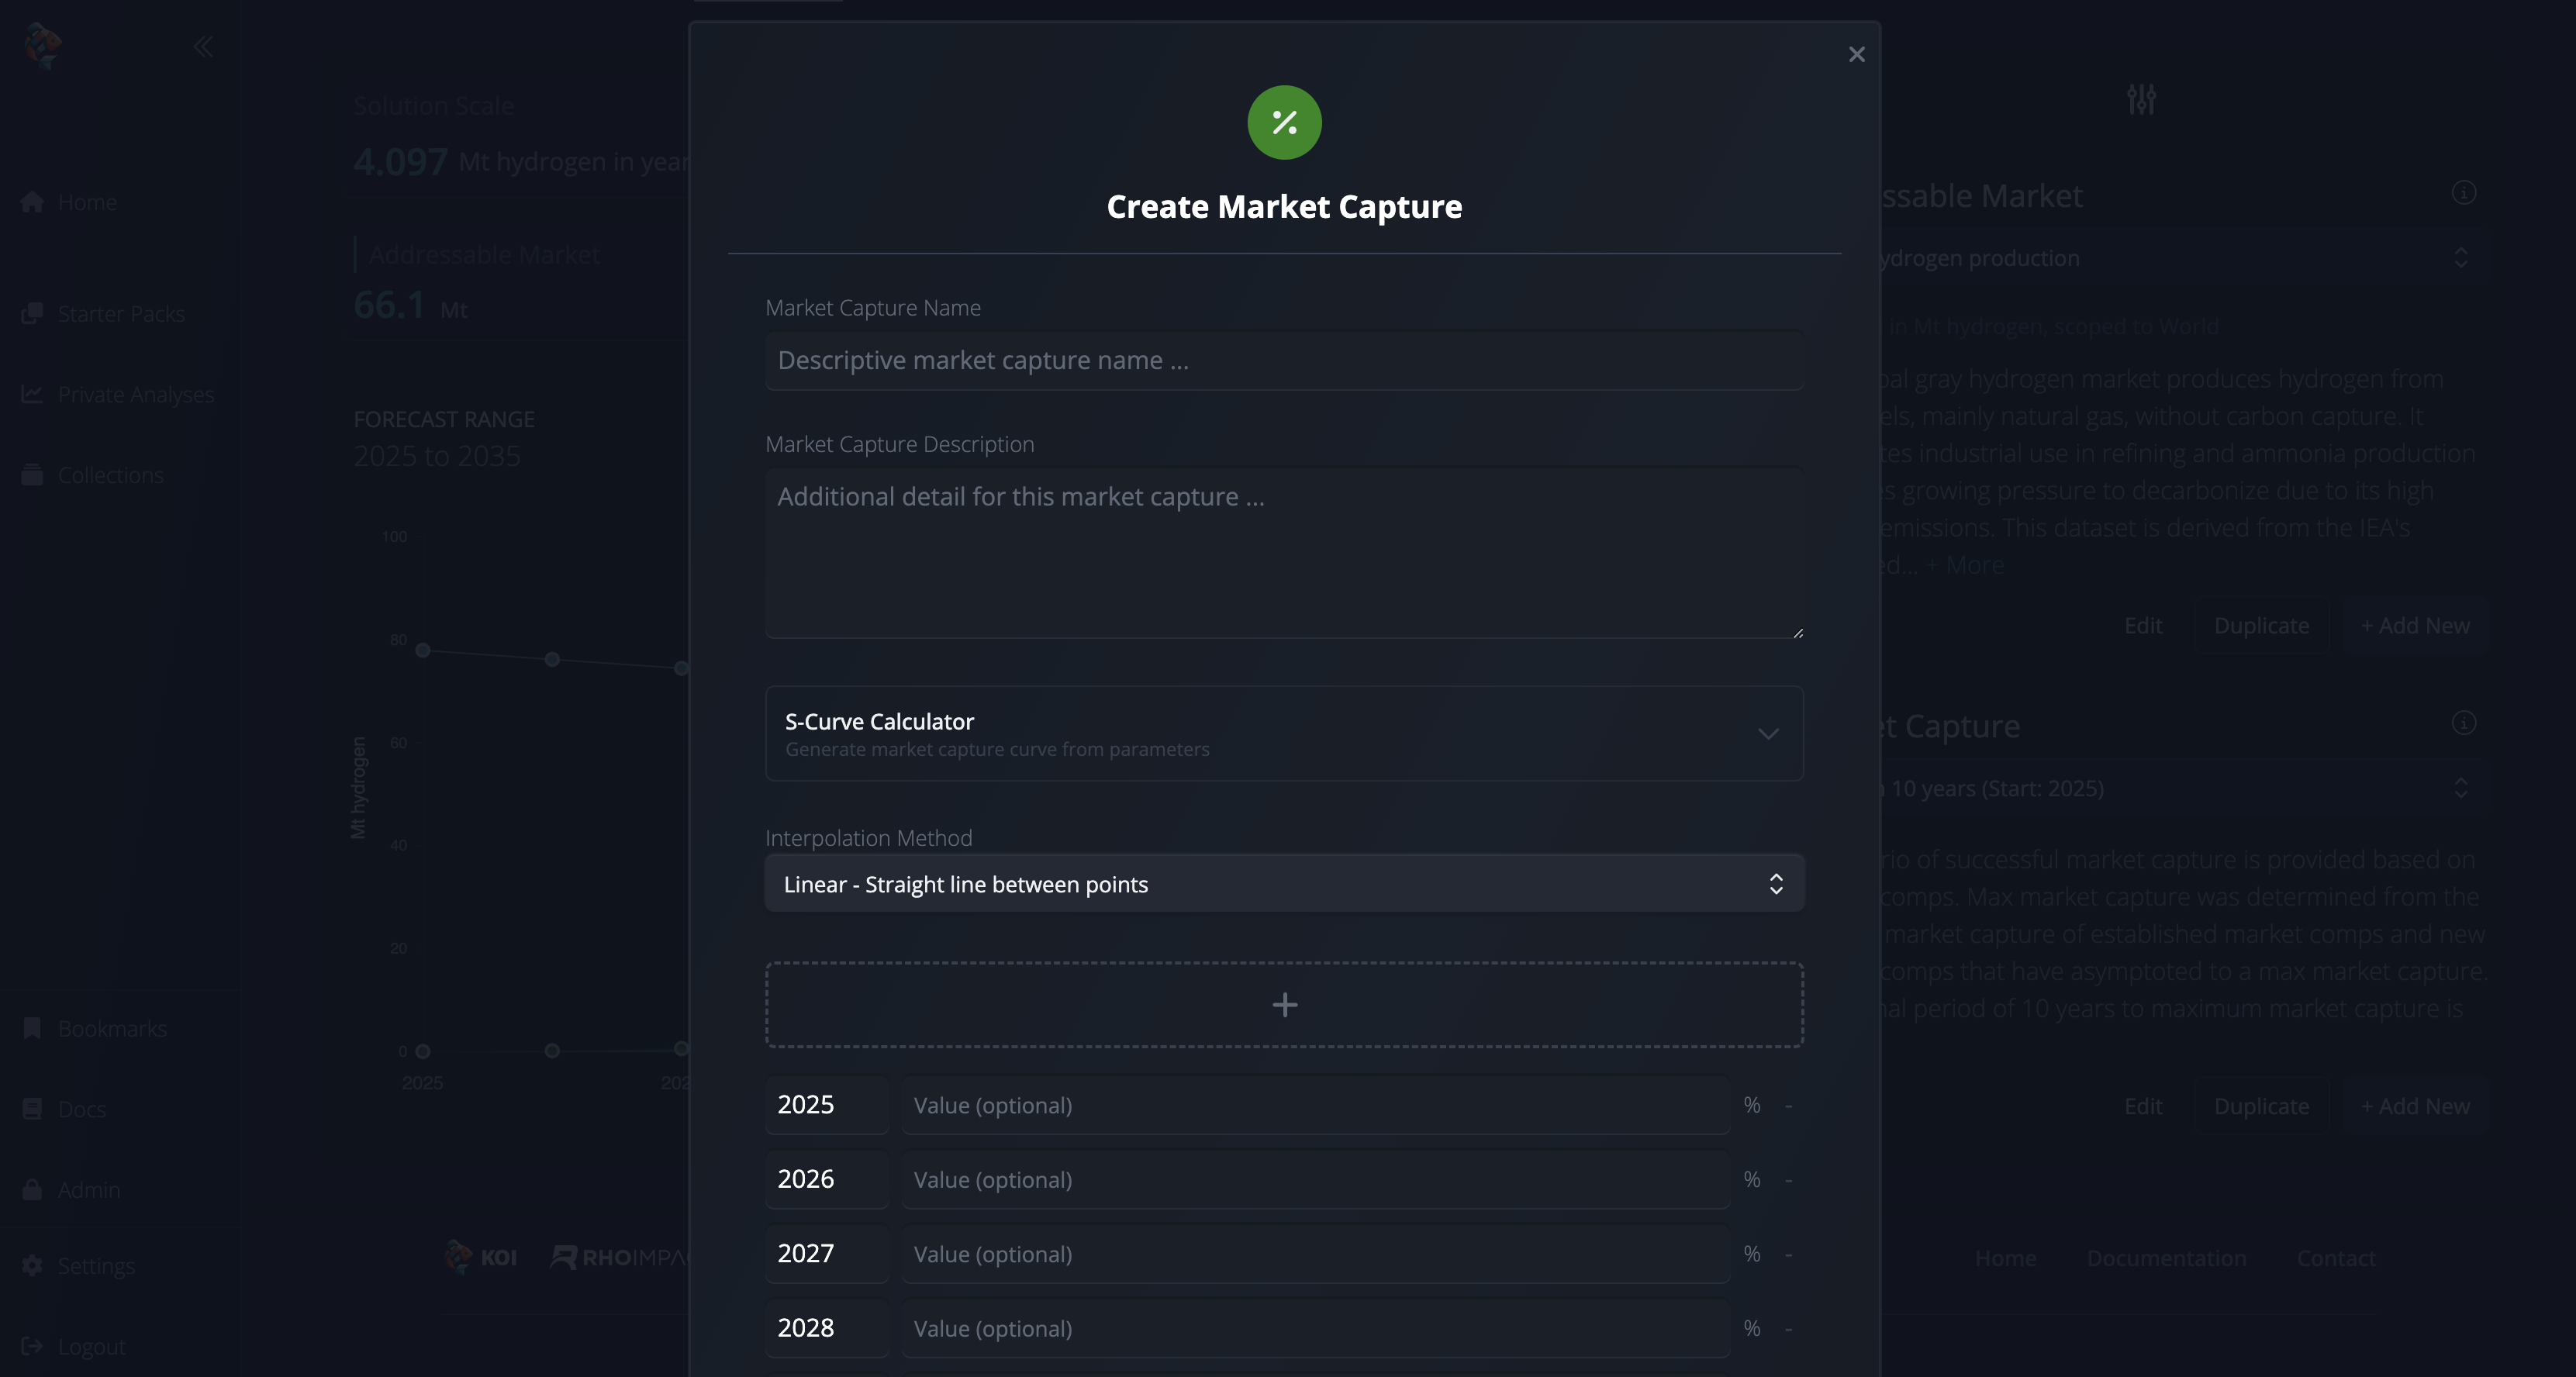
  • Multiple data entry methods — choose how you build your market capture curve: manually enter year-value pairs, generate curves with the S-curve calculator, or use interpolation methods to fill gaps between key data points.

  • Smart interpolation — select from linear, exponential, or other interpolation methods to automatically fill empty values between your data points.

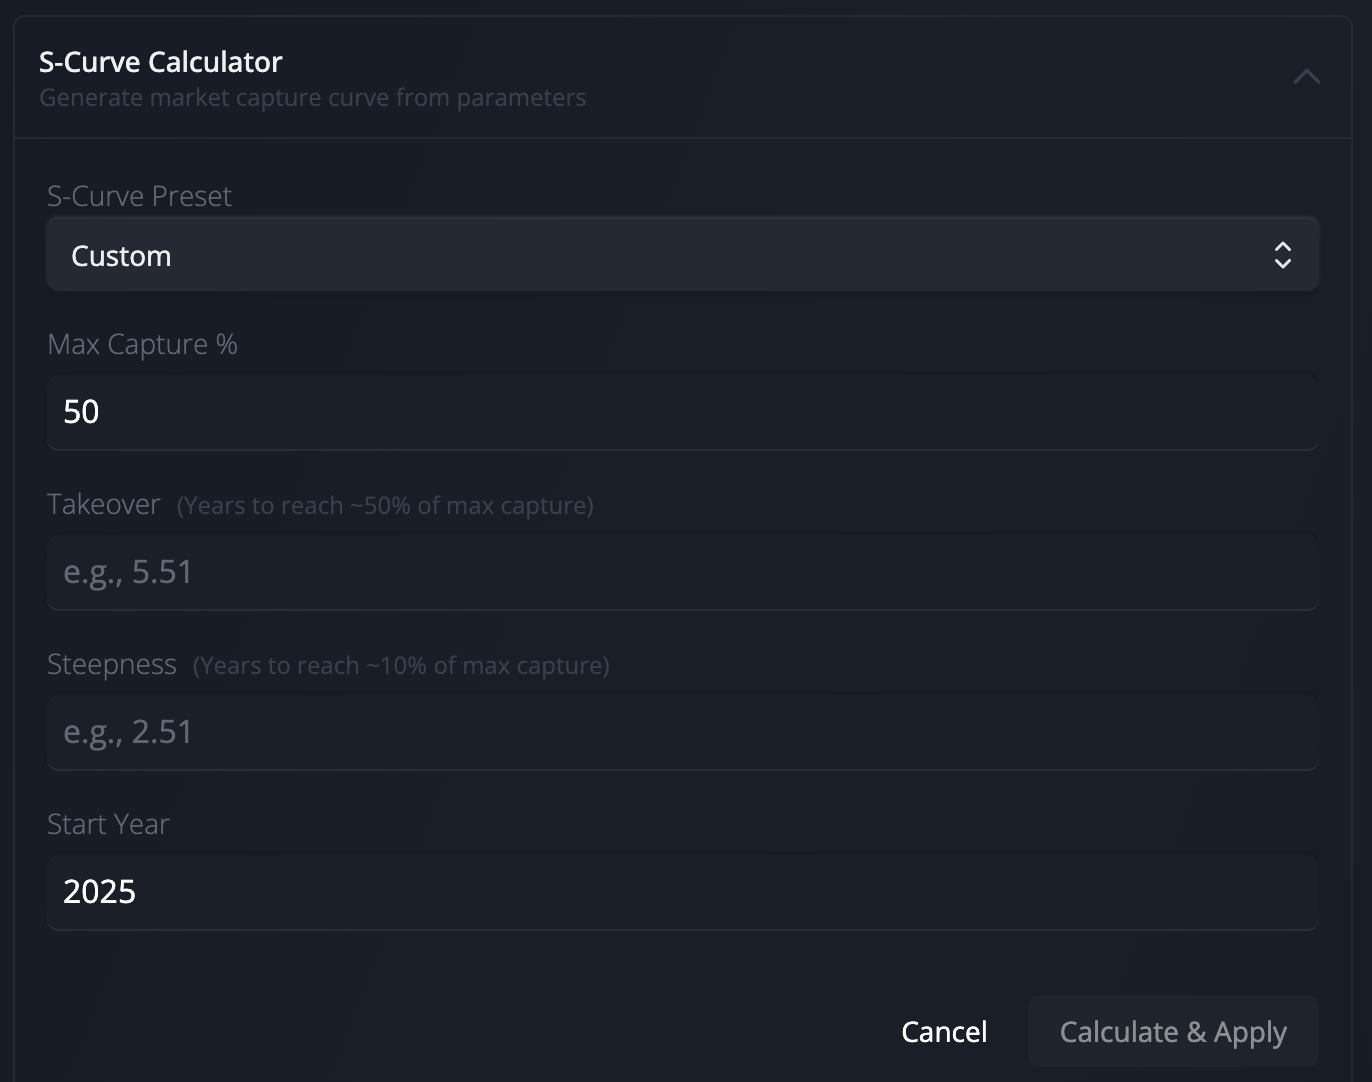
  • S-curve calculator — generate mathematically sound adoption curves from key parameters like max saturation and start year.

  • Clone and edit for scenarios — create variant market captures to explore "what-if" scenarios while preserving your baseline assumptions.

Why is it important?

Market capture data reveals how technologies actually penetrate their target markets, turning theoretical efficiency into real-world impact. Even the most efficient climate technology has limited emissions reduction if adoption stalls. This redesign makes sophisticated market analysis accessible to everyone by offering flexible data entry: start with sparse data points and let interpolation fill the gaps, use the S-curve calculator for theory-based projections, or manually craft your own curve. You can now model realistic adoption scenarios in whichever way best suits your available data and analytical approach.


How Do I Use It?

Creating a Market Capture

  1. Navigate to any technology model's Analysis page

  2. Select Edit Mode from the Actions menu

  3. Select the Solution Scale tab, expand the right sidebar, and select Add New under the Market Capture section

  4. Choose your data entry method:

    • Manual entry: Enter year-value pairs directly for complete control

    • S-curve calculator: Generate curves from parameters like max saturation and start year or select from our preset parameters to model Slower, Standard, or Accelerated growth.

    • Interpolation: Enter key data points, then select an interpolation method (linear, exponential, etc.) to automatically fill gaps

  5. Save your market capture—it's now associated with that technology model

  6. From here, you can Duplicate your market capture and Edit it to adjust parameters for comparison.


Who is this for?

  • Impact Analysts — model realistic adoption curves on market penetration assumptions

  • Researchers — compare adoption scenarios across multiple technologies to identify high-potential interventions

  • Entrepreneurs — understand your company's impact based on your sales projections


FAQ

  • Which data entry method should I use?

    Use the S-curve calculator when you have theory-based assumptions about technology diffusion. Use interpolation when you have key milestone projections and want to fill the gaps with a smooth curve. Use manual entry when you have complete year-by-year data or need precise control over every value.

  • What interpolation methods are available?

    You can choose from linear interpolation (straight line between points), exponential interpolation (accelerating or decelerating curves), and other methods depending on your data characteristics and adoption assumptions.

  • What's the difference between duplicating and editing?

    Editing modifies the existing market capture (creating a new version in its history). Duplicating creates an entirely new market capture, perfect for scenario analysis where you want to preserve the original as a baseline.

  • How does the S-curve calculator work?

    The S-curve calculator uses diffusion theory to generate realistic adoption trajectories. Define key parameters like max saturation, takeover, and steepness, and the calculator generates year-value pairs that follow the desired S-curve pattern. For ease, we also provide a selection of preset parameters to model Slower, Standard, and Accelerated market adoption.

Earlier updates